Unlock a world of possibilities! Login now and discover the exclusive benefits awaiting you.
- Qlik Community
- :
- Forums
- :
- Analytics
- :
- New to Qlik Analytics
- :
- Re: color expression for two measures
- Subscribe to RSS Feed
- Mark Topic as New
- Mark Topic as Read
- Float this Topic for Current User
- Bookmark
- Subscribe
- Mute
- Printer Friendly Page
- Mark as New
- Bookmark
- Subscribe
- Mute
- Subscribe to RSS Feed
- Permalink
- Report Inappropriate Content
color expression for two measures
Hi,
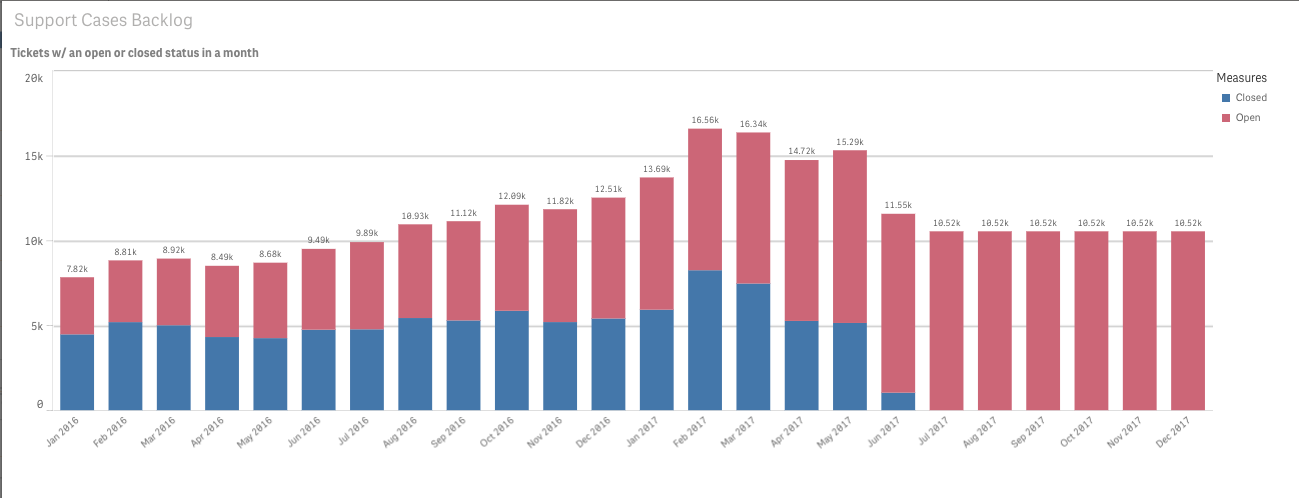
I have a stacked bar chart with two measures that give me the number of open and closed tickets in a given month:

The expression for "closed" is:
Sum(
aggr(
if(month_opened<=_month and (_month<=month_closed or isnull(month_closed) ), 1, 0),
_month,
id
)
)
-
Sum(
aggr(
if(month_opened<=_month and (isnull(month_closed) ), 1, 0),
_month,
id
)
)
And the expression for "open" is:
Sum(
aggr(
if(month_opened<=_month and (isnull(month_closed) ), 1, 0),
_month,
id
)
)
I need to change the color of the open and closed stacked bars, but have not had luck with an if-statement, I think it's because of the use of the aggr function. Any help is much appreciated.
- « Previous Replies
-
- 1
- 2
- Next Replies »
- Mark as New
- Bookmark
- Subscribe
- Mute
- Subscribe to RSS Feed
- Permalink
- Report Inappropriate Content
If you are using 3.2 then you can add these 2 measures as master items and you have the option to set a colour for it in there.
Each time you add the measure it will then always display using the same colour.
Regards
Andy
- Mark as New
- Bookmark
- Subscribe
- Mute
- Subscribe to RSS Feed
- Permalink
- Report Inappropriate Content
It gets a little involved to do this.
You need to define a ValueList in your Dimension like this:
=Valuelist('Performing','Non-performing')
Then in your measure you need to do something like this:
pick(wildmatch(Valuelist('Performing','Non-performing'),'Performing','Non-performing'),
Count({1}{<Rank=-{'Negative','0%<5%'}>}Branch)/Count(Branch),
Count({1}{<Rank={'Negative','0%<5%'}>}Branch)/Count(Branch) )
Then under Appearance/Colors & Legends you need something like this:
pick(wildmatch(Valuelist('Performing','Non-performing'),'Performing','Non-performing'),'#808080','#CF0A2C')
Or you can use a pretty good extension called Bars Plus that let's you do all of this with parameters.
Hope that helps some.
- Mark as New
- Bookmark
- Subscribe
- Mute
- Subscribe to RSS Feed
- Permalink
- Report Inappropriate Content
Hi Mark,
I am not following the logic here?
- Mark as New
- Bookmark
- Subscribe
- Mute
- Subscribe to RSS Feed
- Permalink
- Report Inappropriate Content
Andy, I am using 3.1.4.
- Mark as New
- Bookmark
- Subscribe
- Mute
- Subscribe to RSS Feed
- Permalink
- Report Inappropriate Content
Upgrade to 3.2 you have an easy solution to your issue in it.
Look at the what's new video on the home screen and it shows how you can use the new functionality.
Regards
Andy
- Mark as New
- Bookmark
- Subscribe
- Mute
- Subscribe to RSS Feed
- Permalink
- Report Inappropriate Content
Hi Andy,
I am unable to upgrade at this time. The system admin is out of town for a few months. So I have to code for the colors.
- Mark as New
- Bookmark
- Subscribe
- Mute
- Subscribe to RSS Feed
- Permalink
- Report Inappropriate Content
Heres how it will look when you can upgrade
1. you create your master measures and give it a standard colour
2. you replace your chart measures with the ones in the master library
3. in colours and legends set custom, multicoloured and use library on. this will give you the effect you want plus the legends which you dont get with the by expression approach.

- Mark as New
- Bookmark
- Subscribe
- Mute
- Subscribe to RSS Feed
- Permalink
- Report Inappropriate Content
The chart of the left is the standard colors and the right side is with the code that I provided.
What I sent you is just based on my requirements for the dimensions and metrics. Yours would be different.
- Mark as New
- Bookmark
- Subscribe
- Mute
- Subscribe to RSS Feed
- Permalink
- Report Inappropriate Content
You need to add the additional Dimension with the value list to your regular dimension and then update the logic in your metric and colors to use the ValueList. It is a little messy and took me a couple of attempts to get it to work. But it does work.
- « Previous Replies
-
- 1
- 2
- Next Replies »