Unlock a world of possibilities! Login now and discover the exclusive benefits awaiting you.
- Qlik Community
- :
- Forums
- :
- Analytics
- :
- New to Qlik Analytics
- :
- Re: % Of total row
- Subscribe to RSS Feed
- Mark Topic as New
- Mark Topic as Read
- Float this Topic for Current User
- Bookmark
- Subscribe
- Mute
- Printer Friendly Page
- Mark as New
- Bookmark
- Subscribe
- Mute
- Subscribe to RSS Feed
- Permalink
- Report Inappropriate Content
% Of total row
Good morning,
I am new on Qlik Sense and I have this problem; I try to ask coworkers but no one give me a good solution.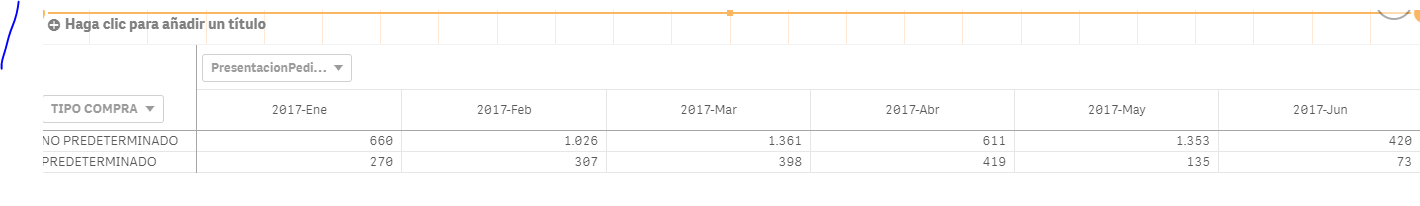
I have this pivot table on Qlik Sense and I would like to create another column that show the % of those values for each month.
For example, for January what I want is to create a column that show 71% for "no predeterminado" and 29% for "Predeterminado".
In an excel it is quite simple but here I have no idea.
Thank you in advance.
- Mark as New
- Bookmark
- Subscribe
- Mute
- Subscribe to RSS Feed
- Permalink
- Report Inappropriate Content
Lets say your expression is
Sum(Measure)....
You can create a new one like this
Sum(Measure)/Sum(TOTAL <MonthYear> Measure)
- Mark as New
- Bookmark
- Subscribe
- Mute
- Subscribe to RSS Feed
- Permalink
- Report Inappropriate Content
Good Morning Sunny,
Ty so much for ur answer, but i already try it before and it doesn´t work. because i have 2 dimensions on the pivot table.
do u have another idea? I will apreciate it
Ty so much
- Mark as New
- Bookmark
- Subscribe
- Mute
- Subscribe to RSS Feed
- Permalink
- Report Inappropriate Content
What are you two dimensions? This should work with two dimensions....Would you be able to post an image with the above expression? (Make sure you use the correct field names and the placeholders I have used in the expressions above)
- Mark as New
- Bookmark
- Subscribe
- Mute
- Subscribe to RSS Feed
- Permalink
- Report Inappropriate Content
This are all my mesures and dimensions.
Row : "TIPO COMPRA"
| =if | (tipoCompra = 'NO PREDETERMINADA' OR tipoCompra = 'NO PREDETERMINADO' OR tipoCompra = 'PREDETERMINADO POR CLIENTE' , 'NO PREDETERMINADO', 'PREDETERMINADO') |
Column: "PresentacionPedido"
=if(year(fhPresentacionPedido) = $(eMaxAno), fhPresentacionPedido_YYYYMM)Column: "PresentaciónPedido"
and the measure is
Count(distinct
{$<
[Liquidacion.TipoProduccionAgrupado] = { 'RENTING' },
[Liquidacion.ProduccionPedidos_Calculado] = { '1' }
>}
if(year(fhCreacionPedido) = $(eMaxAno) and PeriodoFechaFoto = PeriodofhCreacionPedido,
idVehiculo
)
)
Dont know if u need any thing more, if u need pls let me know.
thank you in advance
- Mark as New
- Bookmark
- Subscribe
- Mute
- Subscribe to RSS Feed
- Permalink
- Report Inappropriate Content
Oh you are using a calculated dimension... can you carry out these manipulations in the script (for dimension)?