Unlock a world of possibilities! Login now and discover the exclusive benefits awaiting you.
- Qlik Community
- :
- Forums
- :
- Analytics
- :
- New to Qlik Analytics
- :
- Re: Sum values if they are Distinct based on anoth...
Options
- Subscribe to RSS Feed
- Mark Topic as New
- Mark Topic as Read
- Float this Topic for Current User
- Bookmark
- Subscribe
- Mute
- Printer Friendly Page
Turn on suggestions
Auto-suggest helps you quickly narrow down your search results by suggesting possible matches as you type.
Showing results for
Anonymous
Not applicable
2017-06-18
09:08 PM
- Mark as New
- Bookmark
- Subscribe
- Mute
- Subscribe to RSS Feed
- Permalink
- Report Inappropriate Content
Sum values if they are Distinct based on another field_name
Hello,
I'm trying to find the best place to find the correct syntax definitions for chart functions in the visualization level.
What I'm trying to do is Sum the number of values if for each distinct line of data, that is:
| order_key | cycles |
|---|---|
| 1234 | 5 |
| 1234 | 5 |
| 1235 | 4 |
| 1236 | 5 |
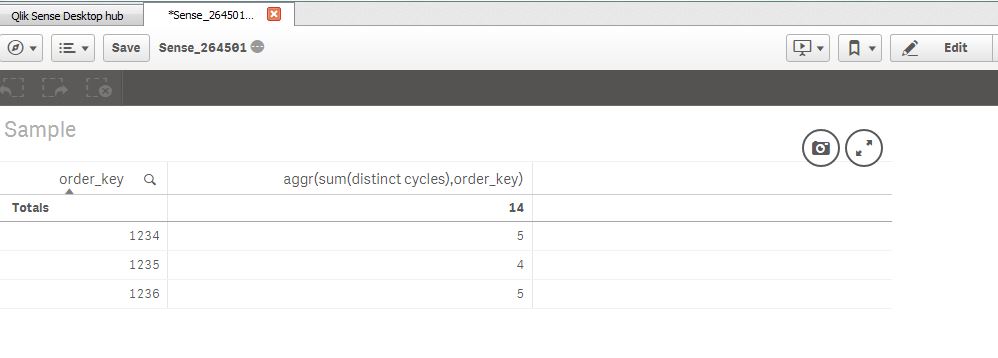
The expected results for this data would be a total of 14 cycles.
I could count distinct cycles but I would only get 9 cycles. I need to count cycles based on the distinct(order_key), is this possible?
Cheers,
Toby
401 Views
1 Solution
Accepted Solutions
Master II
2017-06-19
03:40 AM
- Mark as New
- Bookmark
- Subscribe
- Mute
- Subscribe to RSS Feed
- Permalink
- Report Inappropriate Content
Hi,
Yes, Try like below
Dimension:
Order_Key
Measure
aggr(sum(distinct cycles),order_key)
318 Views
1 Reply
Master II
2017-06-19
03:40 AM
- Mark as New
- Bookmark
- Subscribe
- Mute
- Subscribe to RSS Feed
- Permalink
- Report Inappropriate Content
Hi,
Yes, Try like below
Dimension:
Order_Key
Measure
aggr(sum(distinct cycles),order_key)
319 Views
Community Browser