Unlock a world of possibilities! Login now and discover the exclusive benefits awaiting you.
- Qlik Community
- :
- Forums
- :
- Analytics
- :
- New to Qlik Analytics
- :
- Re: Summary Measure (calculated) Table
- Subscribe to RSS Feed
- Mark Topic as New
- Mark Topic as Read
- Float this Topic for Current User
- Bookmark
- Subscribe
- Mute
- Printer Friendly Page
- Mark as New
- Bookmark
- Subscribe
- Mute
- Subscribe to RSS Feed
- Permalink
- Report Inappropriate Content
Summary Measure (calculated) Table
Hi all,
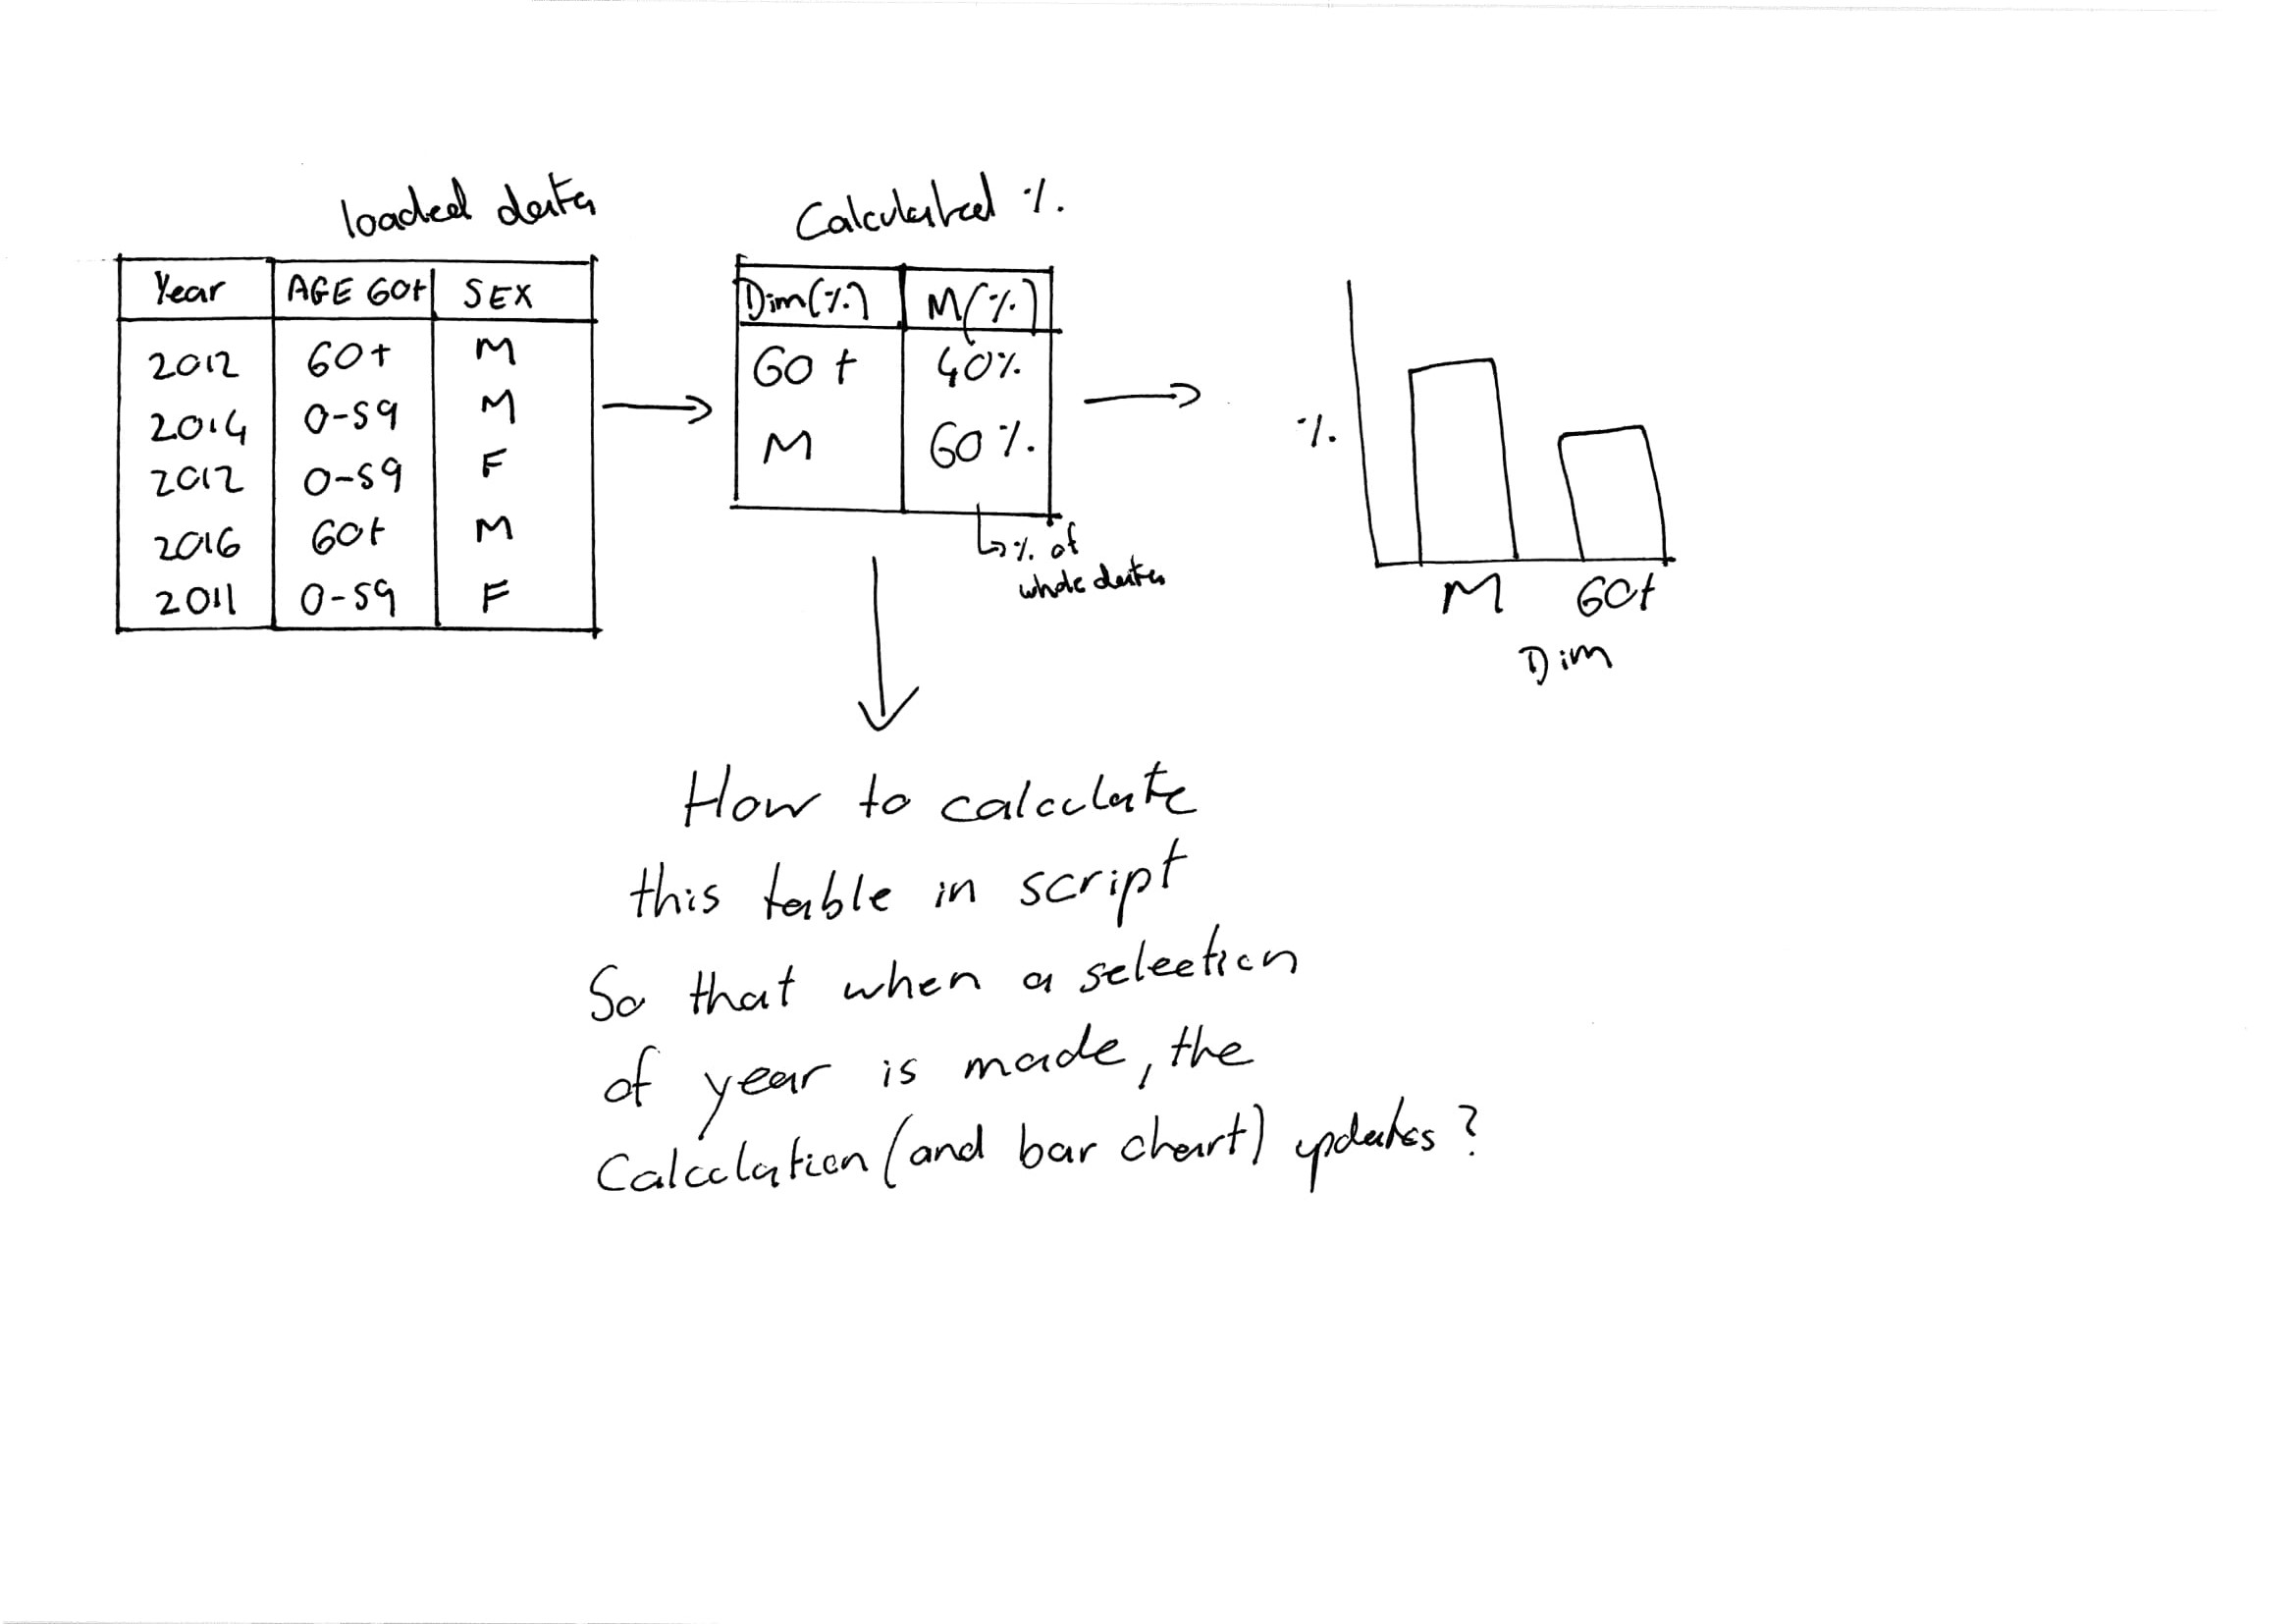
I'm trying to figure out how to create a summary measure table which is calculated off my original source table. The idea is to summarise (in %) the counts of 2 or more columns but allow that summary to be affected by selection made in chart. attached
Please see attached my (crudely) drawn diagram which I hope better shows what I'm trying to do.
I'm currently using Qlik Sense
Thanks everyone.
Accepted Solutions
- Mark as New
- Bookmark
- Subscribe
- Mute
- Subscribe to RSS Feed
- Permalink
- Report Inappropriate Content
Hi,
Please try:
tab1 - load all the data from the file
Summary_tab:
Load [AGE 60+] as field1,sum(if([AGE60+]='60+',1,0))/Count([AGE 60+]) as field2 resident tab1
group by [AGE 60+];
Concatenate (Summary_tab)
Load [Sex] as field1,sum(if([sex]='M',1,0))/Count([sex]) as field2 resident tab1
group by [sex];
- Mark as New
- Bookmark
- Subscribe
- Mute
- Subscribe to RSS Feed
- Permalink
- Report Inappropriate Content
i suggest you to provide a sample app (.qvf) to understand better what's your goal.
- Mark as New
- Bookmark
- Subscribe
- Mute
- Subscribe to RSS Feed
- Permalink
- Report Inappropriate Content
Hi,
Please try:
tab1 - load all the data from the file
Summary_tab:
Load [AGE 60+] as field1,sum(if([AGE60+]='60+',1,0))/Count([AGE 60+]) as field2 resident tab1
group by [AGE 60+];
Concatenate (Summary_tab)
Load [Sex] as field1,sum(if([sex]='M',1,0))/Count([sex]) as field2 resident tab1
group by [sex];
- Mark as New
- Bookmark
- Subscribe
- Mute
- Subscribe to RSS Feed
- Permalink
- Report Inappropriate Content
There is no need to anything in the script, You can load data as is, and build calculated table and chart on the front end. See attached.
Warning: I'm using ValueList() function here. If you have a large application (hundreds of MB), it is risky for performance. In small or midsize app it will be fine.
- Mark as New
- Bookmark
- Subscribe
- Mute
- Subscribe to RSS Feed
- Permalink
- Report Inappropriate Content
Thanks for your reply, I found to be quite useful.
However, here is the way that I worked it out:
SummaryTable:
load [AGE 60+] as [Measure(%)], '% Age 60+' as Dim%, Resident [Source] where [AGE 60+] = '60 +';
load [Sex] as [Measure(%)], '% Male' as Dim%, Resident [Source] where [Sex] = 'M';
On the pivot table expression I used
Count([Measure(%)])/Count(ID) to work out % of total.
Thanks 