Unlock a world of possibilities! Login now and discover the exclusive benefits awaiting you.
- Qlik Community
- :
- All Forums
- :
- QlikView App Dev
- :
- How do I make a bubble chart?
- Subscribe to RSS Feed
- Mark Topic as New
- Mark Topic as Read
- Float this Topic for Current User
- Bookmark
- Subscribe
- Mute
- Printer Friendly Page
- Mark as New
- Bookmark
- Subscribe
- Mute
- Subscribe to RSS Feed
- Permalink
- Report Inappropriate Content
How do I make a bubble chart?
I'm not understanding the logic of a bubble chart. I have to show schedule variance vs budget variance. With the size of the bubble correlating with the budget. I have to have a way for users to see dates other than today and the colour of the chart is based on the region.
Any guidance would be great. Thanks!
- Tags:
- new_to_qlikview
- Mark as New
- Bookmark
- Subscribe
- Mute
- Subscribe to RSS Feed
- Permalink
- Report Inappropriate Content
Regardless if the bubble chart is appropriate or not in your specific situation:
Bubble chart is just a scatter chart with three expressions. The first two expresions define the position of the data point, and the 3rd expression is the bubble size. And, make sure to choose one of the scatter type styles that support bubbles. There are 8 types for the scatter chart, only three are "bubble-compliant".
Regards,
Michael
- Mark as New
- Bookmark
- Subscribe
- Mute
- Subscribe to RSS Feed
- Permalink
- Report Inappropriate Content
Michael,
I'm am just new to QV as of yesterday, so please bear with me. When you say the 3rd experssion is the bubble size - what does that mean? And what would that look like? So the first two expressions would be - at least in my case - sum(schedule_variance) and sum(budget_variance)? And the dimension would be the managing office?
Thank you.
- Mark as New
- Bookmark
- Subscribe
- Mute
- Subscribe to RSS Feed
- Permalink
- Report Inappropriate Content
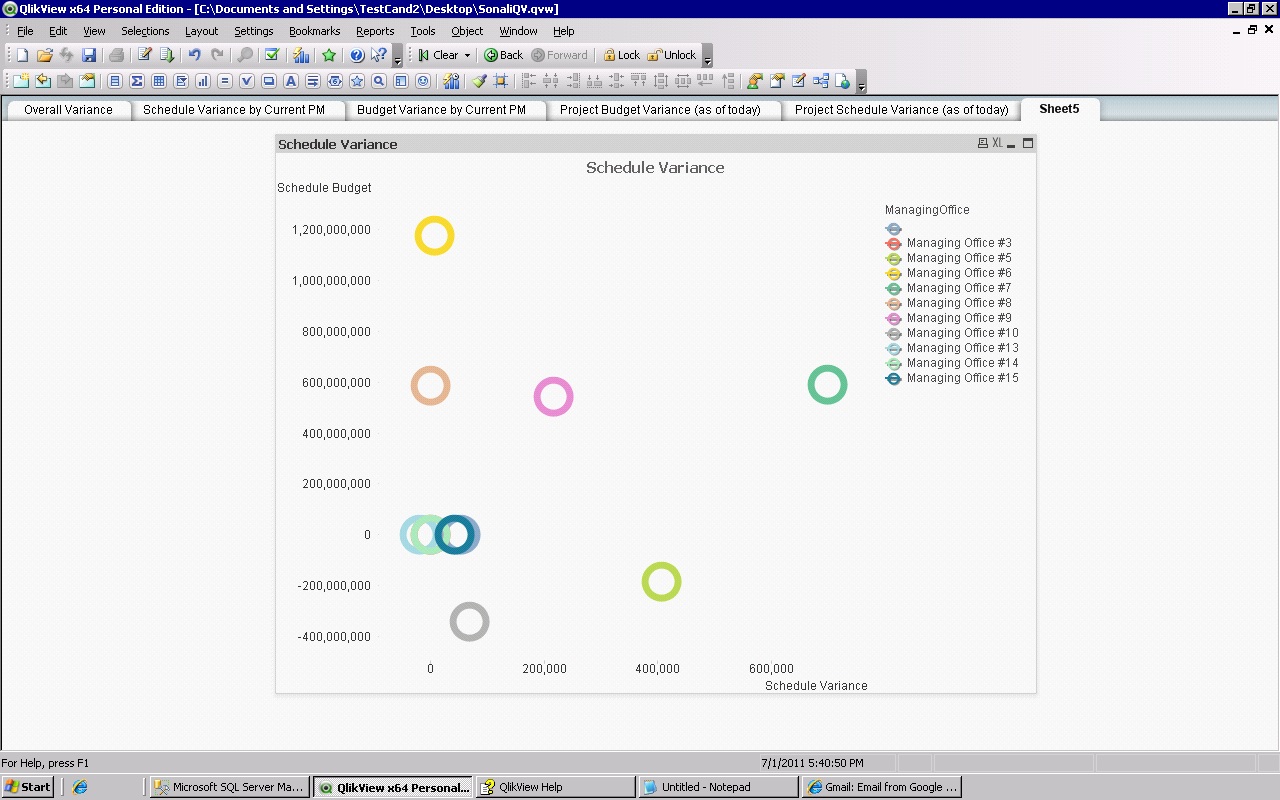
Below is what I have done on the bubble chart so far.
dimension = managing office
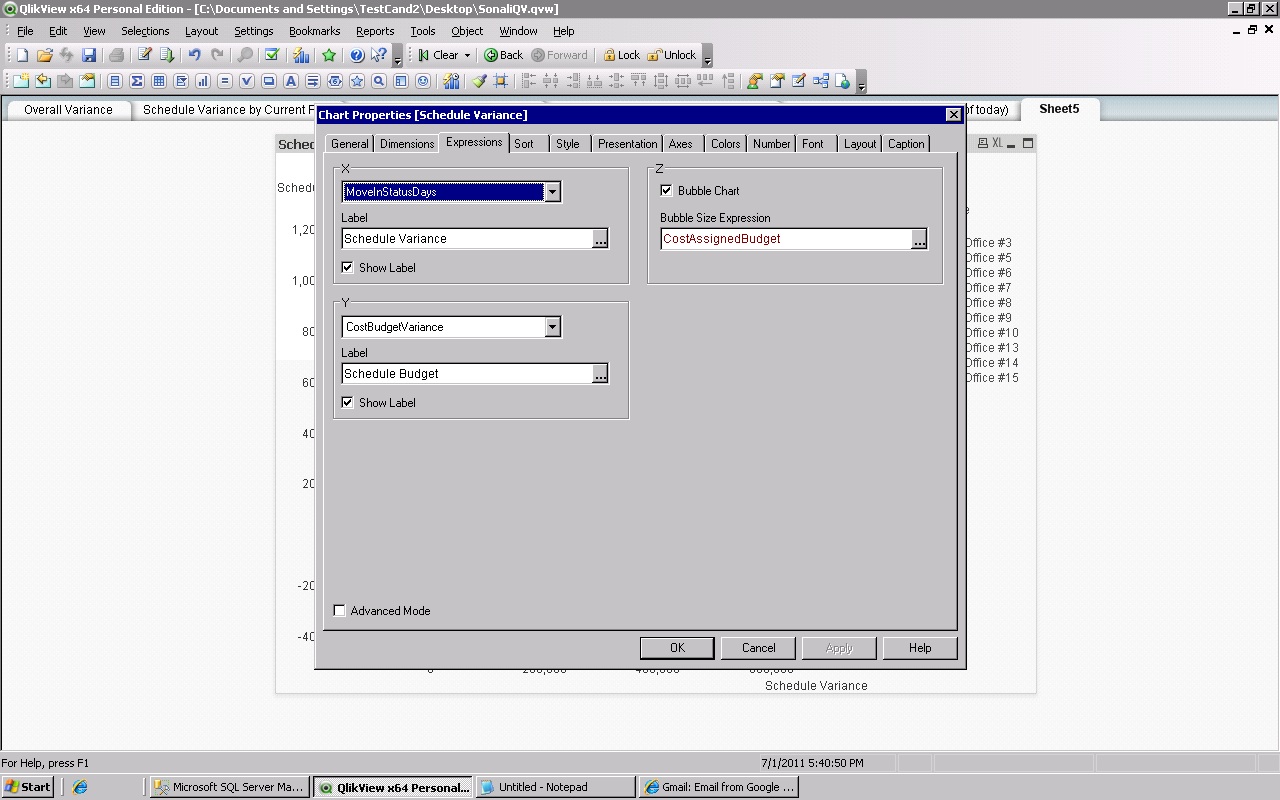
expression = schedule variance (movein..), budget variance (costbudget..), managing office (for bubble size).
I have to make the size of the bubble correlate to the budget of the project (which I'm assuming is "costassignedbudget"). However, the size doesn't seem to be varying according to the budget.
I also have to make the color based on managing office - which I think worked?
The last functionality I have to provide is allowing users to see the bubble chart for dates other than today - I'm totally lost on that one - any ideas?
- Mark as New
- Bookmark
- Subscribe
- Mute
- Subscribe to RSS Feed
- Permalink
- Report Inappropriate Content
The "bubble size expression" here doesn't look to me as expression. Try sum() function.
I don't know your data model nor requirements, but the other parts look reasonable.