Unlock a world of possibilities! Login now and discover the exclusive benefits awaiting you.
- Qlik Community
- :
- All Forums
- :
- QlikView App Dev
- :
- Re: Help! Chart function to work out volume?
- Subscribe to RSS Feed
- Mark Topic as New
- Mark Topic as Read
- Float this Topic for Current User
- Bookmark
- Subscribe
- Mute
- Printer Friendly Page
- Mark as New
- Bookmark
- Subscribe
- Mute
- Subscribe to RSS Feed
- Permalink
- Report Inappropriate Content
Help! Chart function to work out volume?
I'm trying to make a bar chart to show the comparison between the volume of change orders and the volume of purchase orders (issued to the same vendor). I think the way to do this is to count the changeorder_number and the purchaseorder_num - I want to count to instances of these numbers to get the volume. Eg, lets say there were three change orders A, B and C. The volume would be three. I used the count function in the expression - is this correct?
- Tags:
- new_to_qlikview
- « Previous Replies
-
- 1
- 2
- Next Replies »
- Mark as New
- Bookmark
- Subscribe
- Mute
- Subscribe to RSS Feed
- Permalink
- Report Inappropriate Content
Hi kiwichickny,
I think you answered your own questions 😉
{Yes, I think this is correct}
Regards,
Stefan
- Mark as New
- Bookmark
- Subscribe
- Mute
- Subscribe to RSS Feed
- Permalink
- Report Inappropriate Content
Hi Stefan,
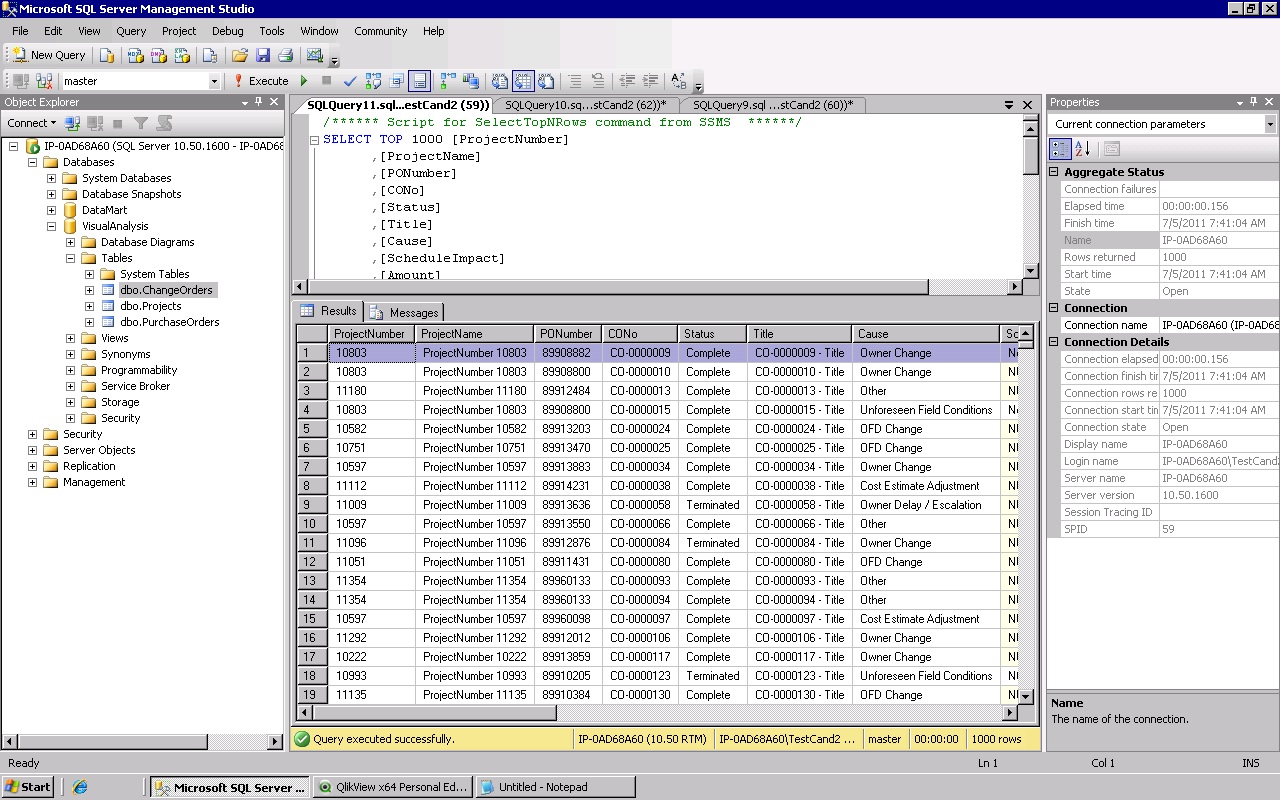
Thank you for your help. The only reason I'm questioning myself is because when I make the chart I can't seem any values for ChangeOrder_Volume - I can only see purchase order. I have attached the data for a clearer explaination. There several projects and for each project there are different vendors and there are multiple purchase orders associated with each vendor and in turn change orders associated with the purchase order. Is there any reason why I'm not seeing the change order volume when I'm doing a count on the CoNO? I have also attached the task I'm trying to do.
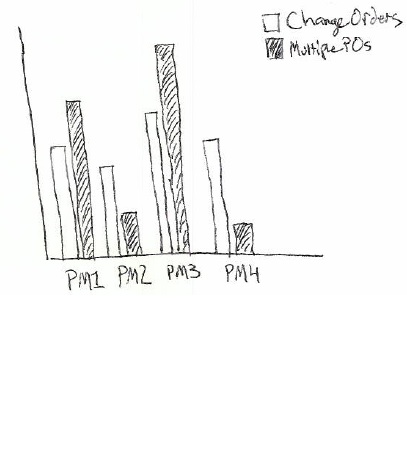
CHANGE ORDERS AND PURCHASE ORDERS
Executiveswould also like to see for each project manager the volume of change ordersthat have been issued for their projects. This should be compared to volume ofmultiple purchase orders that have been issued to the same vendor on a project.
Optionalfeatures/functionality:
- Group by Managing office and Vendor
- Mark as New
- Bookmark
- Subscribe
- Mute
- Subscribe to RSS Feed
- Permalink
- Report Inappropriate Content
Hi kiwichickny,
it would be good to see your QlikView table table scheme also.
If you try to plot purchase volume vs. change order volume, what dimension (X-axis) do you graph?
For example, if you add list boxes for vendor, projects, purchases and change orders, if you select a vendor, do all other lists get filtered accordingly (i.e. are the associations right?)
As you know, QlikView links tables by fieldnames, so you migth change a name to get a working link.
Regards,
Stefan
- Mark as New
- Bookmark
- Subscribe
- Mute
- Subscribe to RSS Feed
- Permalink
- Report Inappropriate Content
I have attached the table schema. Is it correct?
Thanks for your help. I'm in an interview process and my potential employer
wants me to do this project (this is one part) and I never used QV.
On Tue, Jul 5, 2011 at 8:13 AM, swuehl <
- Mark as New
- Bookmark
- Subscribe
- Mute
- Subscribe to RSS Feed
- Permalink
- Report Inappropriate Content
Hi kiwichickny,
well, then good luck for your interview, first!
{If you never worked with QlikView before, it might be good if you work through the builing your first application samples delivered with qlikview desktop, to get a understanding how things work}
I see in your table, that you have a lot of common field names in Change orders and Purchase orders like status, amount, end date and start date. QlikView links these fields automatically, but linking more than one field table to table results in a synthetic key which might be problematic.
First, I would try to build a most simple data model and then add as you proceed in your project.
Only load the fields you need and rename fields that are not key fields (for example, I would start with renaming or removing status fields, e.g. rename them to status_co and status_purchase).
{You probably know that you do this in your load script?}
Proceed until you don't have a synthetic key anymore, and a most simple table structure.
Regards,
Stefan
- Mark as New
- Bookmark
- Subscribe
- Mute
- Subscribe to RSS Feed
- Permalink
- Report Inappropriate Content
Okay, sounds great. I'll go into the script editor and rename common fields.
I'll let you know how it goes. Thanks so much!
On Tue, Jul 5, 2011 at 8:34 AM, swuehl <
- Mark as New
- Bookmark
- Subscribe
- Mute
- Subscribe to RSS Feed
- Permalink
- Report Inappropriate Content
I'm in the process of renaming the common field names...do I rename fields like projectnumber in the change order and purchase order tables - when it's the primary key in the projects table?
- Mark as New
- Bookmark
- Subscribe
- Mute
- Subscribe to RSS Feed
- Permalink
- Report Inappropriate Content
No!
Key fields should have the same name, but try to minimize the number of key fields.
Stefan
- Mark as New
- Bookmark
- Subscribe
- Mute
- Subscribe to RSS Feed
- Permalink
- Report Inappropriate Content
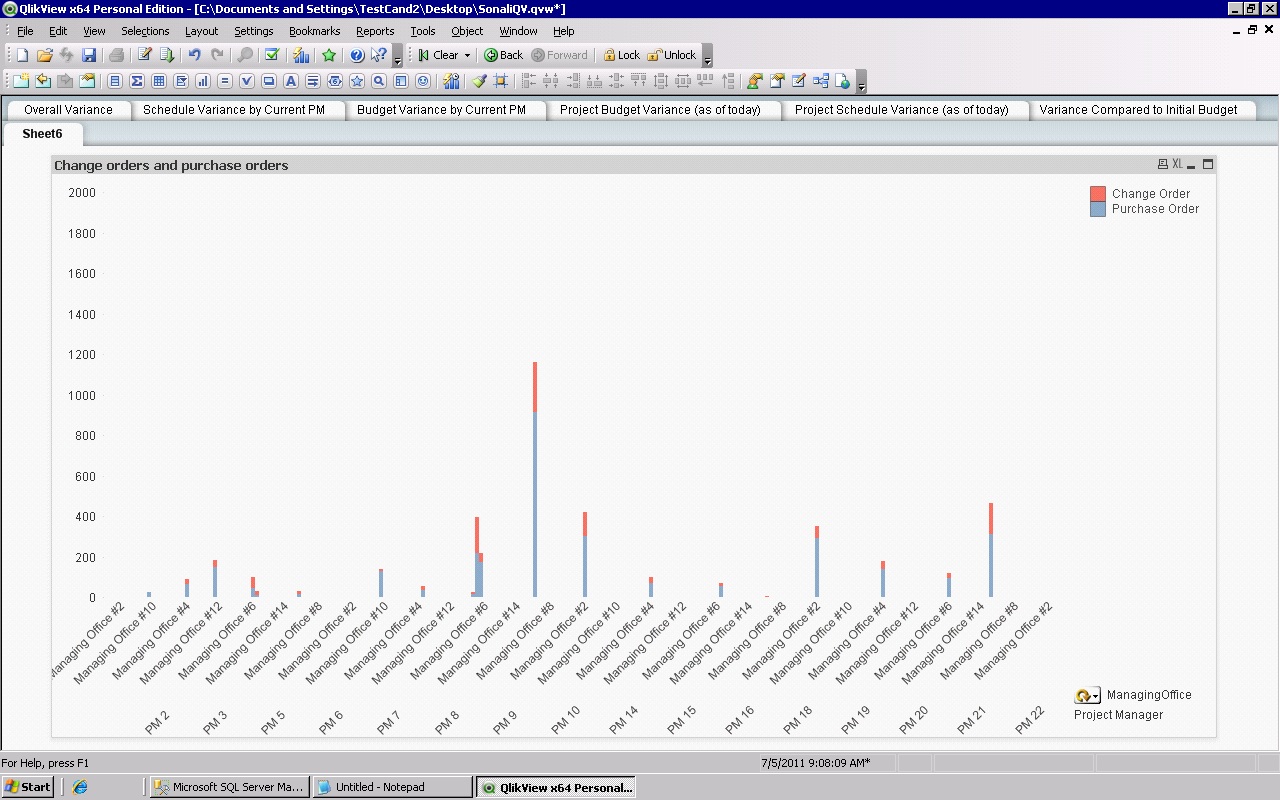
That did the trick! I can now see both purchase and change order information on the graph! Thank you!
The task wants me to show the volume for change orders by project manager and the purchase orders by vendor. Is it possible to put this on the same chart?
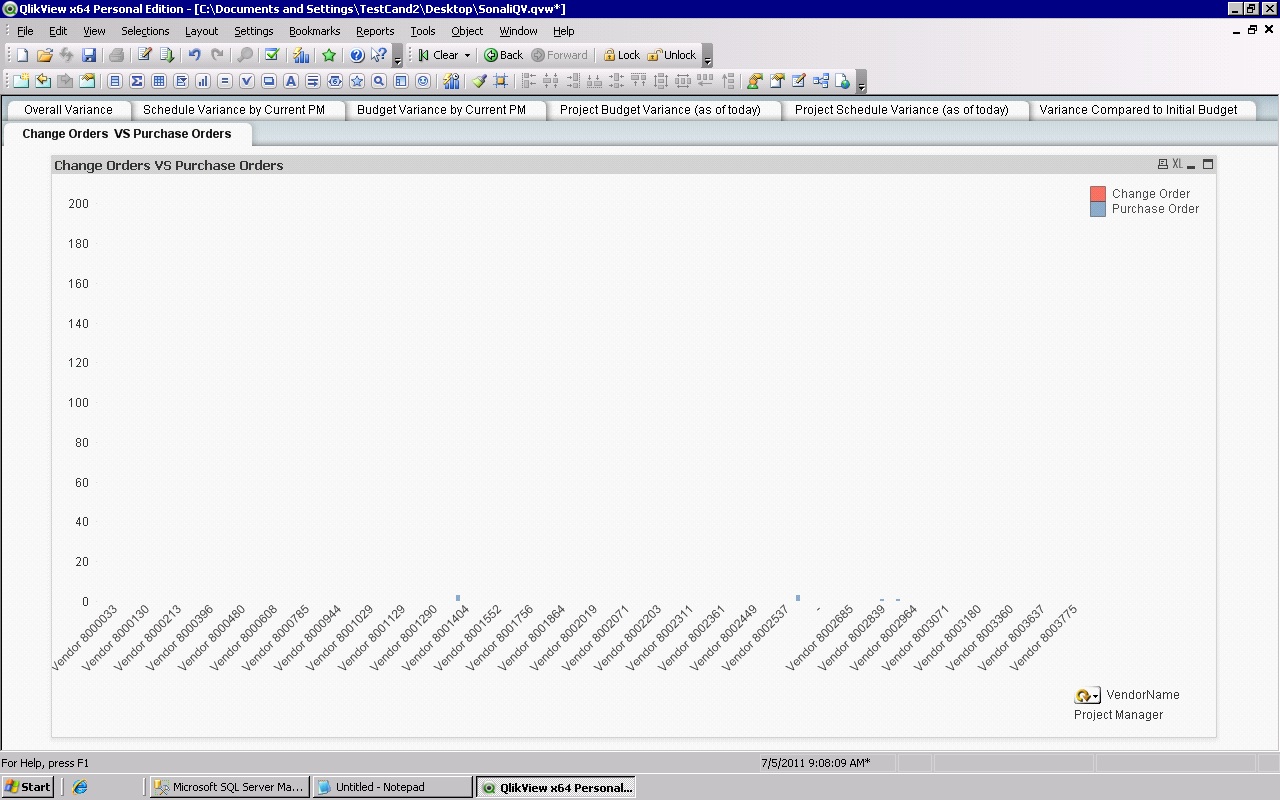
I don't think the expressions I have - count(changeorder_num) and count(purchaseorder_num) does this? Plus I have to group by managing office and vendor. So far I have made project manager a dimension and the count(changeorder_num) and count(purchaseorder_num) my expressions. To show grouping by managing office and vendor I used the group feature - the cyclic one...is this correct? I've attached a screen shot of what I have so far.
Thank you!
- « Previous Replies
-
- 1
- 2
- Next Replies »