Unlock a world of possibilities! Login now and discover the exclusive benefits awaiting you.
- Qlik Community
- :
- Forums
- :
- Analytics
- :
- App Development
- :
- Re: Values On X-Axis of Line Graph
Options
- Subscribe to RSS Feed
- Mark Topic as New
- Mark Topic as Read
- Float this Topic for Current User
- Bookmark
- Subscribe
- Mute
- Printer Friendly Page
Turn on suggestions
Auto-suggest helps you quickly narrow down your search results by suggesting possible matches as you type.
Showing results for
Not applicable
2017-07-11
10:37 AM
- Mark as New
- Bookmark
- Subscribe
- Mute
- Subscribe to RSS Feed
- Permalink
- Report Inappropriate Content
Values On X-Axis of Line Graph
Hello All,
I have a line graph that looks like this:
.png)
As you may guess, I only records for Jan to Mar and I would like the graph to stop at that point.
I tried ticking 'Use Continuous Scale' but when I do that, this happens:
.png)
I feel like the solution to this is obvious, apologises if this is a foolish question.
Best wishes,
Alison
- Tags:
- labels
- line graph
505 Views
1 Solution
Accepted Solutions
Anonymous
Not applicable
2017-07-11
11:22 AM
Author
- Mark as New
- Bookmark
- Subscribe
- Mute
- Subscribe to RSS Feed
- Permalink
- Report Inappropriate Content
Alison,
Tick off "Include zero values" in the Add-ons section.
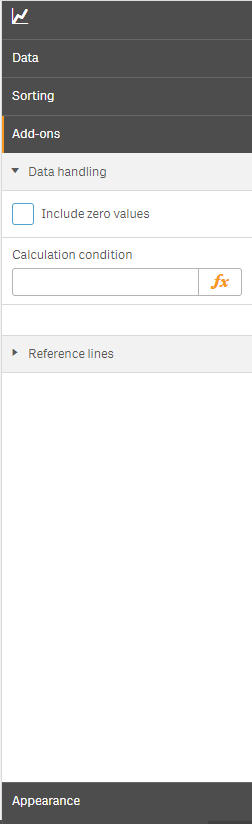
Hope that helps!
Laleh
2 Replies
Anonymous
Not applicable
2017-07-11
11:22 AM
Author
- Mark as New
- Bookmark
- Subscribe
- Mute
- Subscribe to RSS Feed
- Permalink
- Report Inappropriate Content
Alison,
Tick off "Include zero values" in the Add-ons section.
Hope that helps!
Laleh
Not applicable
2017-07-11
11:29 AM
Author
- Mark as New
- Bookmark
- Subscribe
- Mute
- Subscribe to RSS Feed
- Permalink
- Report Inappropriate Content
Hi Laleh,
Great! Thanks a lot!
Community Browser