Unlock a world of possibilities! Login now and discover the exclusive benefits awaiting you.
- Qlik Community
- :
- Forums
- :
- Analytics
- :
- New to Qlik Analytics
- :
- Re: Question about loading data
- Subscribe to RSS Feed
- Mark Topic as New
- Mark Topic as Read
- Float this Topic for Current User
- Bookmark
- Subscribe
- Mute
- Printer Friendly Page
- Mark as New
- Bookmark
- Subscribe
- Mute
- Subscribe to RSS Feed
- Permalink
- Report Inappropriate Content
Question about loading data
Hello all,
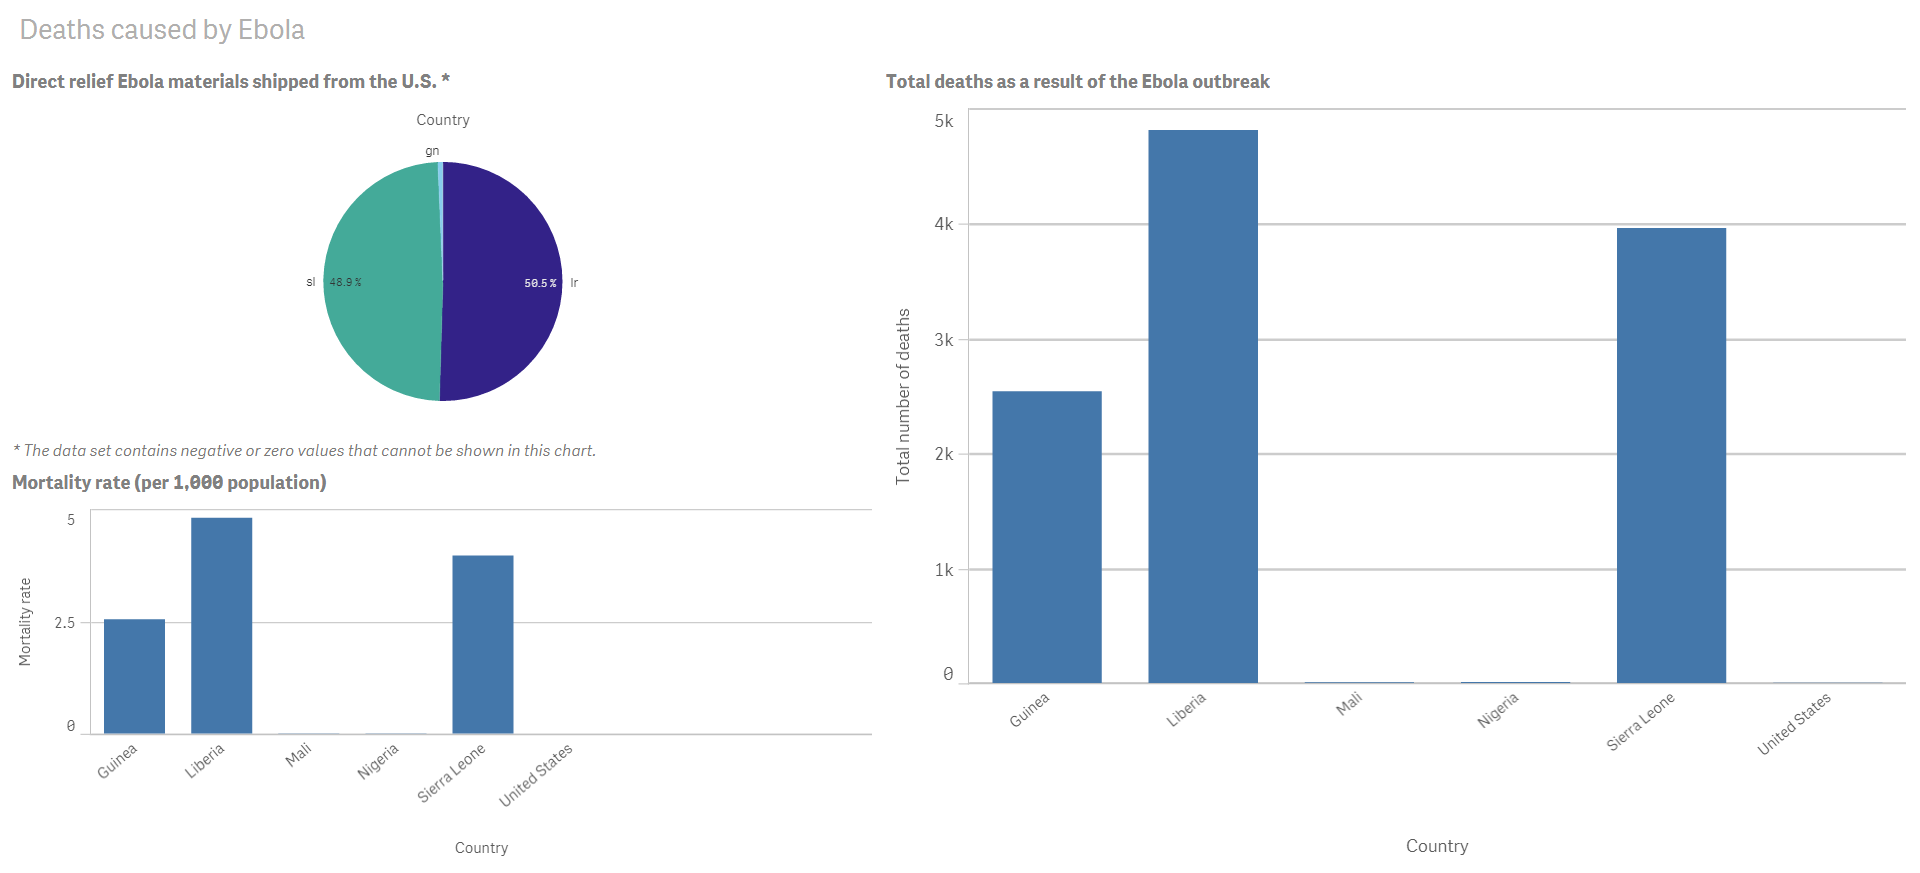
I am currently working on a Qlik visualization that utilizes about 800 rows of data regarding shipments to African countries. I am planning on creating a pie chart to show the different ratios. However, my other graphs in the dashboard have countries such as Sierra Leone and Guinea written completely whereas this new Excel data sheet with the 800 rows has them labeled "sl" and "gn" in each individual. As it would be both extraneous and tedious to go row-by-row changing the names of each country, I was wondering if there was any easier way to do this. I will attach a picture below of my current dashboard for more insight. I appreciate any help and thanks again!
Sincerely,
Munna
- « Previous Replies
-
- 1
- 2
- Next Replies »
- Mark as New
- Bookmark
- Subscribe
- Mute
- Subscribe to RSS Feed
- Permalink
- Report Inappropriate Content
Hello,
I tried that and I still have several other errors showing up. Thank for your continued assistance.
- Mark as New
- Bookmark
- Subscribe
- Mute
- Subscribe to RSS Feed
- Permalink
- Report Inappropriate Content
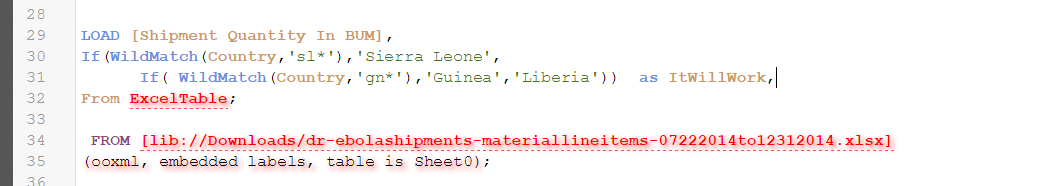
wow sorry put a last one at the and before AS
If(WildMatch(Country,'sl*'),'Sierra Leone',
If( WildMatch(Country,'gn*'),'Guinea','Liberia')) as ItWillWork,
- Mark as New
- Bookmark
- Subscribe
- Mute
- Subscribe to RSS Feed
- Permalink
- Report Inappropriate Content
no worries, I appreciate all the help. I'm learning a lot. However, I am still receiving errors after these statements.
- Mark as New
- Bookmark
- Subscribe
- Mute
- Subscribe to RSS Feed
- Permalink
- Report Inappropriate Content
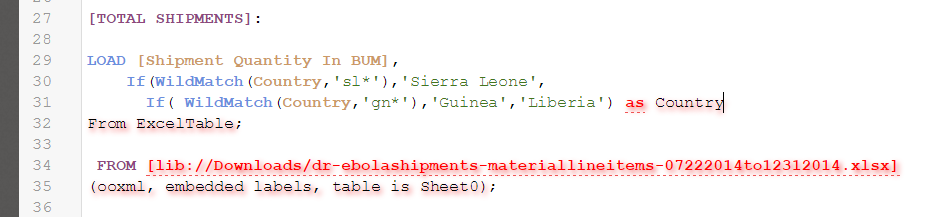
[TOTAL SHIPMENTS]:
LOAD [Shipment Quantity In BUM],
If(WildMatch(Country,'sl*'),'Sierra Leone',
If( WildMatch(Country,'gn*'),'Guinea','Liberia')) as Country
FROM [lib://Downloads/dr-ebolashipments-materiallineitems-07222014to12312014.xlsx]
(ooxml, embedded labels, table is Sheet0);
Did This Work For You??
- Mark as New
- Bookmark
- Subscribe
- Mute
- Subscribe to RSS Feed
- Permalink
- Report Inappropriate Content
Delete From ExcelTable; 
- Mark as New
- Bookmark
- Subscribe
- Mute
- Subscribe to RSS Feed
- Permalink
- Report Inappropriate Content
Hi Debasish,
This can be done by using Mapping Load and ApplyMap functionality. Below are the steps-
1) Prepare one excel data having short names and full names like below-
| Country | Country_Full |
| sl | Sierra Leone |
| gn | Guinea |
2) Go to script and load data from excel like below-
COUNTRY_MAPPING:
Mapping Load
Country,
Country_Full
From <table name>;
Total_Shipments:
Load
Shipment_Qty,
ApplyMap('COUNTRY_MAPPING', Country, 'NA') as Country
From ExcelData;
Hope it will work. Please let us know.
Thanks,
Joy
- Mark as New
- Bookmark
- Subscribe
- Mute
- Subscribe to RSS Feed
- Permalink
- Report Inappropriate Content
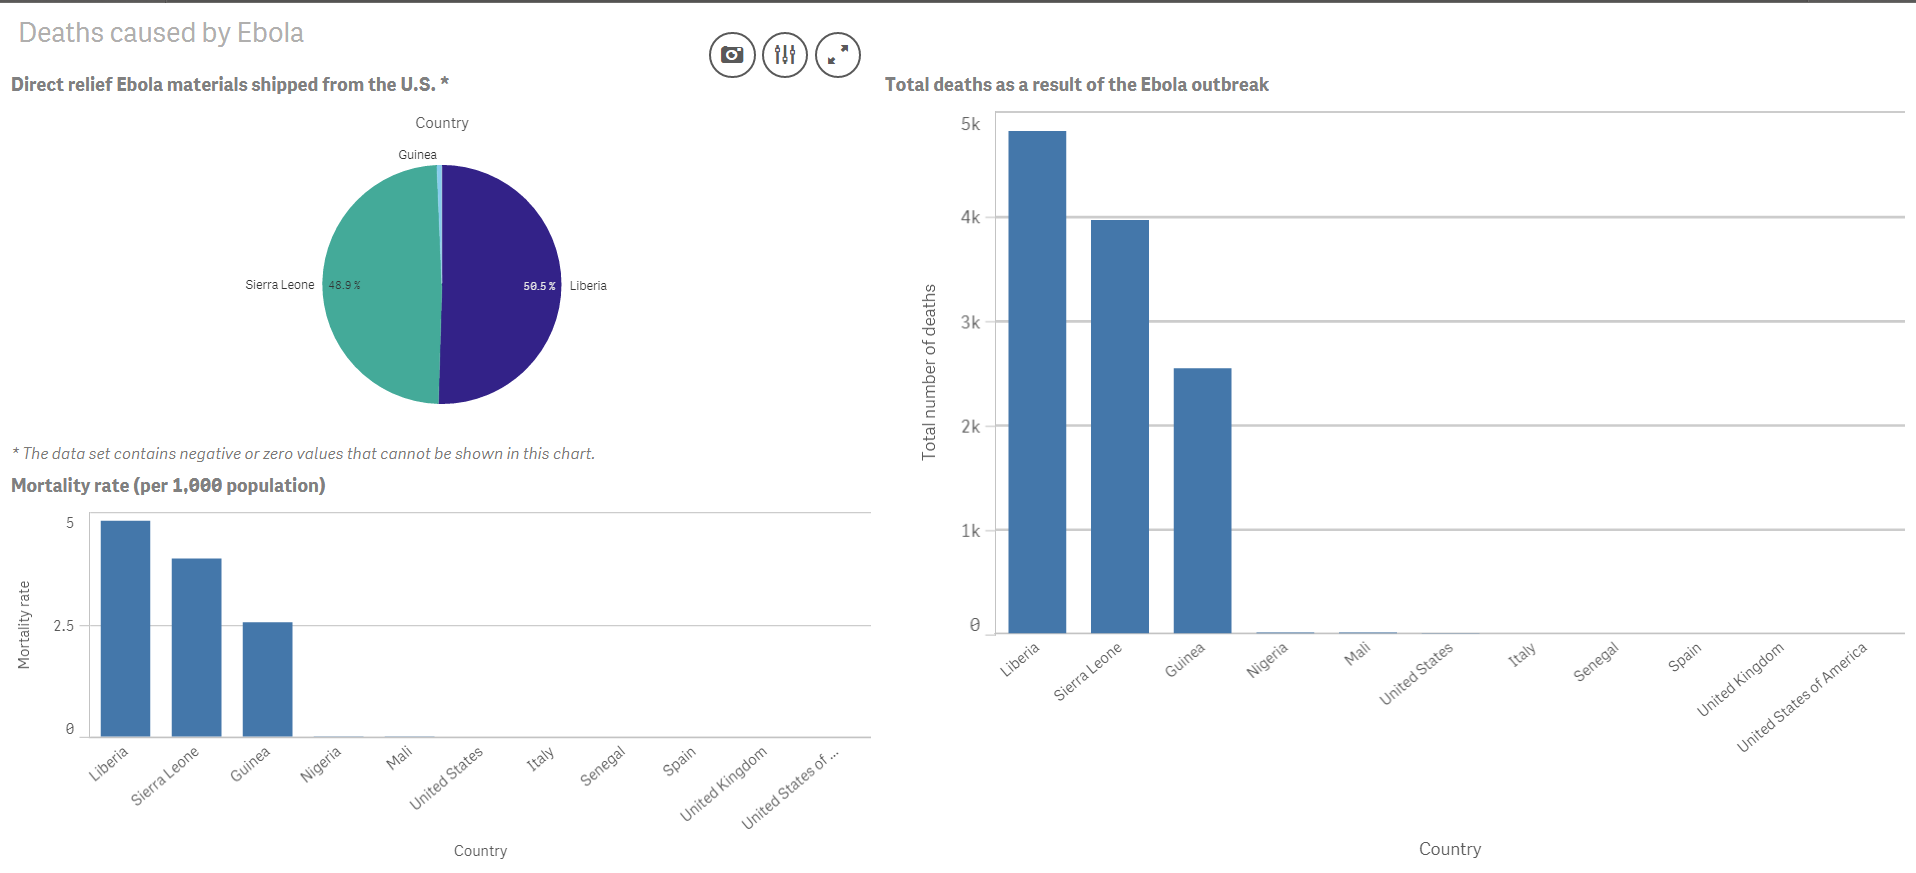
Yes, it worked! Thank you so much, Aar. I can see that all the countries have changed accordingly. Thank you to Daniel as well since I was able to get closer. Removing the line [Country] also helped, Bill.
- Mark as New
- Bookmark
- Subscribe
- Mute
- Subscribe to RSS Feed
- Permalink
- Report Inappropriate Content
Hello all,
I realize this is unrelated to my previous question and I couldn't thank you all enough. I may have forgotten this, but how can I not display data that is below 1,000 in my visualization. I believe that portion is unnecessary to display. Thanks again!
- Mark as New
- Bookmark
- Subscribe
- Mute
- Subscribe to RSS Feed
- Permalink
- Report Inappropriate Content
Note: I did uncheck "include null values" so there is data present, although it may not seem so.
- « Previous Replies
-
- 1
- 2
- Next Replies »