Unlock a world of possibilities! Login now and discover the exclusive benefits awaiting you.
- Qlik Community
- :
- Forums
- :
- Analytics
- :
- New to Qlik Analytics
- :
- Re: Rolling 30 days avg
- Subscribe to RSS Feed
- Mark Topic as New
- Mark Topic as Read
- Float this Topic for Current User
- Bookmark
- Subscribe
- Mute
- Printer Friendly Page
- Mark as New
- Bookmark
- Subscribe
- Mute
- Subscribe to RSS Feed
- Permalink
- Report Inappropriate Content
Rolling 30 days avg
Hi,
I have filters Date, Month, Year.
Taken date in X-axis and written the expression for rolling 30 days.
when I am selecting date, it is displaying that particular date only not previous 30 day.
please find the expression
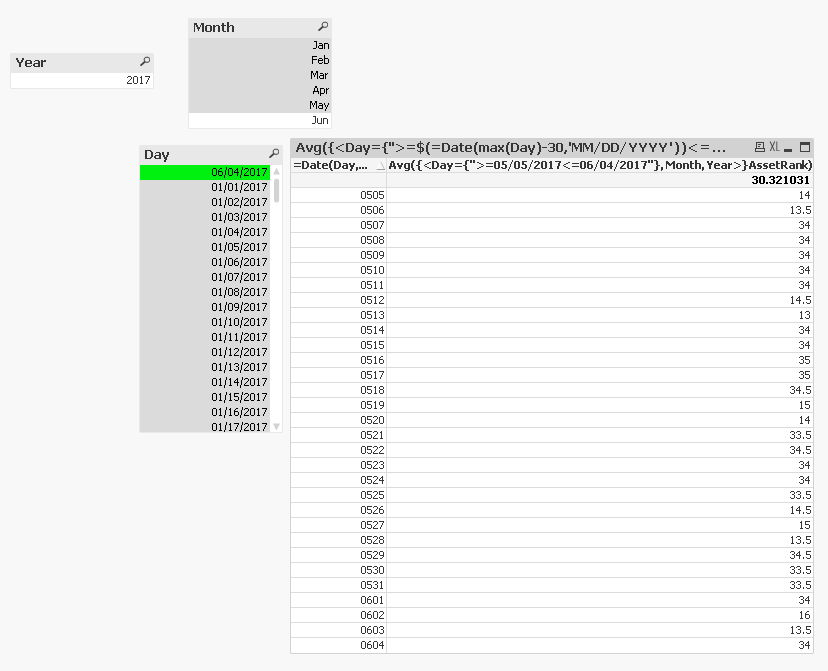
Avg({<Day={">=$(=Date(max(Day)-30,'MM/DD/YYYY'))<=$(=Date(max(Day),'MM/DD/YYYY'))"}>}AssetRank)
could you suggest any mistakes I have done in this expression.
- « Previous Replies
-
- 1
- 2
- Next Replies »
- Mark as New
- Bookmark
- Subscribe
- Mute
- Subscribe to RSS Feed
- Permalink
- Report Inappropriate Content
Please export a straight table to Excel without a label to the expression.
So you will get the calculation of your set Analysis in the Excel label.
Regards
- Mark as New
- Bookmark
- Subscribe
- Mute
- Subscribe to RSS Feed
- Permalink
- Report Inappropriate Content
Seems to be working for me
- Mark as New
- Bookmark
- Subscribe
- Mute
- Subscribe to RSS Feed
- Permalink
- Report Inappropriate Content
Hi sunny really good, But I am associating calendar key with fact calendar key.
I have taken another two rows in pivot table and day as column horizontally.
This is not isolated table. is that issue becoz of calendar table connecting with fact and some other dim?
Please let me know
- Mark as New
- Bookmark
- Subscribe
- Mute
- Subscribe to RSS Feed
- Permalink
- Report Inappropriate Content
My friend, you have only partially shared your problem and I can only partially answer this. I wished for you to share the complete chart with me... but you didn't  .
.
Can you share the whole problem now instead of doing it in bits and pieces
- Mark as New
- Bookmark
- Subscribe
- Mute
- Subscribe to RSS Feed
- Permalink
- Report Inappropriate Content
Hi Sunny,
My dear friend, I have AssetRank column in fact and Day column in Calendar dim table. Along with this I have EquipmentID and EquipmentCategory from same Fact.
Calendar dim is associating with fact by calendarkey. So I am taking EquipmentID and EquipmentCategory as rows in qlik sense Pivot table and taking Day as column and expression is rolling 30 days of AssetRank.
Here I am using Day as filter in the filter list. Initially it is showing 30 days but when selecting day then it showing only that day.
If this info is not enough please let me know, I will give that also.
- Mark as New
- Bookmark
- Subscribe
- Mute
- Subscribe to RSS Feed
- Permalink
- Report Inappropriate Content
Just looking for three things
1) a qvw application where I can see the problem
2) based on whatever data you have in there what is the output needed (in numerical terms)
3) a little description of the issue (if not already provided above)
- Mark as New
- Bookmark
- Subscribe
- Mute
- Subscribe to RSS Feed
- Permalink
- Report Inappropriate Content
I have attached the result how I am expecting and please find the below expression.
Avg({<Day={'>=$(=Date(max(Day)-30,'MM/DD/YYYY'))<=$(=Date(max(Day),'MM/DD/YYYY'))'}>}AssetRank)
Please find the sample data in the attached xlsx and this is qvf file not qvw. I cannot able to send the qvf file.
Thanks,
- Mark as New
- Bookmark
- Subscribe
- Mute
- Subscribe to RSS Feed
- Permalink
- Report Inappropriate Content
Hi,
I have implemented finally rolling 30 days avg as below expression
Avg({1<Day={'>=$(=Date(max(Day)-30,'MM/DD/YYYY'))<=$(=Date(max(Day),'MM/DD/YYYY'))'}>}AssetRank)
Now it is showing 30 days rolling but not reflecting based on other filter selections.
Is there any way to solve this problem? and if select row value in pivot table also not displaying only that value.
Please reply if any body have idea.
- Mark as New
- Bookmark
- Subscribe
- Mute
- Subscribe to RSS Feed
- Permalink
- Report Inappropriate Content
I have solved the issue today.
Thanks,
- « Previous Replies
-
- 1
- 2
- Next Replies »