Unlock a world of possibilities! Login now and discover the exclusive benefits awaiting you.
- Qlik Community
- :
- Forums
- :
- Analytics
- :
- New to Qlik Analytics
- :
- Re: Price variation - Count function
- Subscribe to RSS Feed
- Mark Topic as New
- Mark Topic as Read
- Float this Topic for Current User
- Bookmark
- Subscribe
- Mute
- Printer Friendly Page
- Mark as New
- Bookmark
- Subscribe
- Mute
- Subscribe to RSS Feed
- Permalink
- Report Inappropriate Content
Price variation - Count function
Hi everyone,
I do use a Count funciton in a KPI object to calculate the number of prices which went up over the laster year but I cannot make it with my current formula!
Count(Avg([Year]={2016})Price >Avg([Year]={2017})Price)
Do you have any tips or advices?
Thanks a lot
Florian
- « Previous Replies
-
- 1
- 2
- Next Replies »
- Mark as New
- Bookmark
- Subscribe
- Mute
- Subscribe to RSS Feed
- Permalink
- Report Inappropriate Content
Thanks for your help, due to your tips I have indentified the issue and the problem was my dimensions..
I had two dimensions at the beginning but by deleting I have solved the problem 
It works using:
Sum(Aggr(If(round(Avg({<[Year]={2016}>}Price),0.01) > round(Avg
({<[.Year]={2017}>}Price),0.01), 1, 0),ItemCode))
You're right, sorry for the formula. I am using this one:
if(round((Avg({1<[Year]={2017} >}Price)-Avg({1<[Year]
={2016} >}Price))/Avg({1<[Year]={2016} >}Price),0.01)>0,lightgreen(),
if(round((Avg({1<[Year]={2017} >}Price)-Avg({1<[Year]
={2016} >}Price))/Avg({1<[Year]={2016} >}Price),0.01)<0,lightred(),))
I doesn't work for value which are really close to zero such as 0.46% of price variation.
Cheers,
Florian
- Mark as New
- Bookmark
- Subscribe
- Mute
- Subscribe to RSS Feed
- Permalink
- Report Inappropriate Content
May be this
If((Avg({1<[Year] = {2017}>} Price) - Avg({1<[Year] = {2016}>} Price))/Avg({1<[Year] = {2016}>} Price) > 0, LightGreen(),
If((Avg({1<[Year] = {2017}>} Price) - Avg({1<[Year] = {2016}>} Price))/Avg({1<[Year] = {2016}>} Price) < 0, LightRed()))
- Mark as New
- Bookmark
- Subscribe
- Mute
- Subscribe to RSS Feed
- Permalink
- Report Inappropriate Content
This expression works correctly but I was trying to use the round() function because I do get some slightly differences in my prices between 2016 and 2017 and my price variation can end up beeing -0.00%. (-0.0000009%)
What I'm trying to achieve is not to get any color formatting for this number because rounded to 2 decimal it is still 0.00%.
Thanks
Florian
- Mark as New
- Bookmark
- Subscribe
- Mute
- Subscribe to RSS Feed
- Permalink
- Report Inappropriate Content
Since 0.46% = 0.0046, it might make sense to do a rounding for 4 digits
- Mark as New
- Bookmark
- Subscribe
- Mute
- Subscribe to RSS Feed
- Permalink
- Report Inappropriate Content
I feel really stupid while reading your answer 
I have one last question if you have some time left (if you don't know it yet, you're saving my life..)
I want to create a table with the TOP 5 variations upwards and downwards for the items I bought. I am struggling with If and rank function but I am not sure which one I should use.
(Avg({1<[Year]={2017},ItemCode={"rank(
(Avg({1<[Year]={2017} >}Price)-Avg({1<[Year]
={2016} >}Price))
*(Sum({1<[Year]={2016} >}Quantity))
)<=10"} >}Price)-Avg({1<[Year]
={2016} >}Price))/Avg({1<[Year]={2016} >}Price)
Thanks you so much
Florian
- Mark as New
- Bookmark
- Subscribe
- Mute
- Subscribe to RSS Feed
- Permalink
- Report Inappropriate Content
When you say variation, is this your last column (percentage change from 2016 to 2017)?
- Mark as New
- Bookmark
- Subscribe
- Mute
- Subscribe to RSS Feed
- Permalink
- Report Inappropriate Content
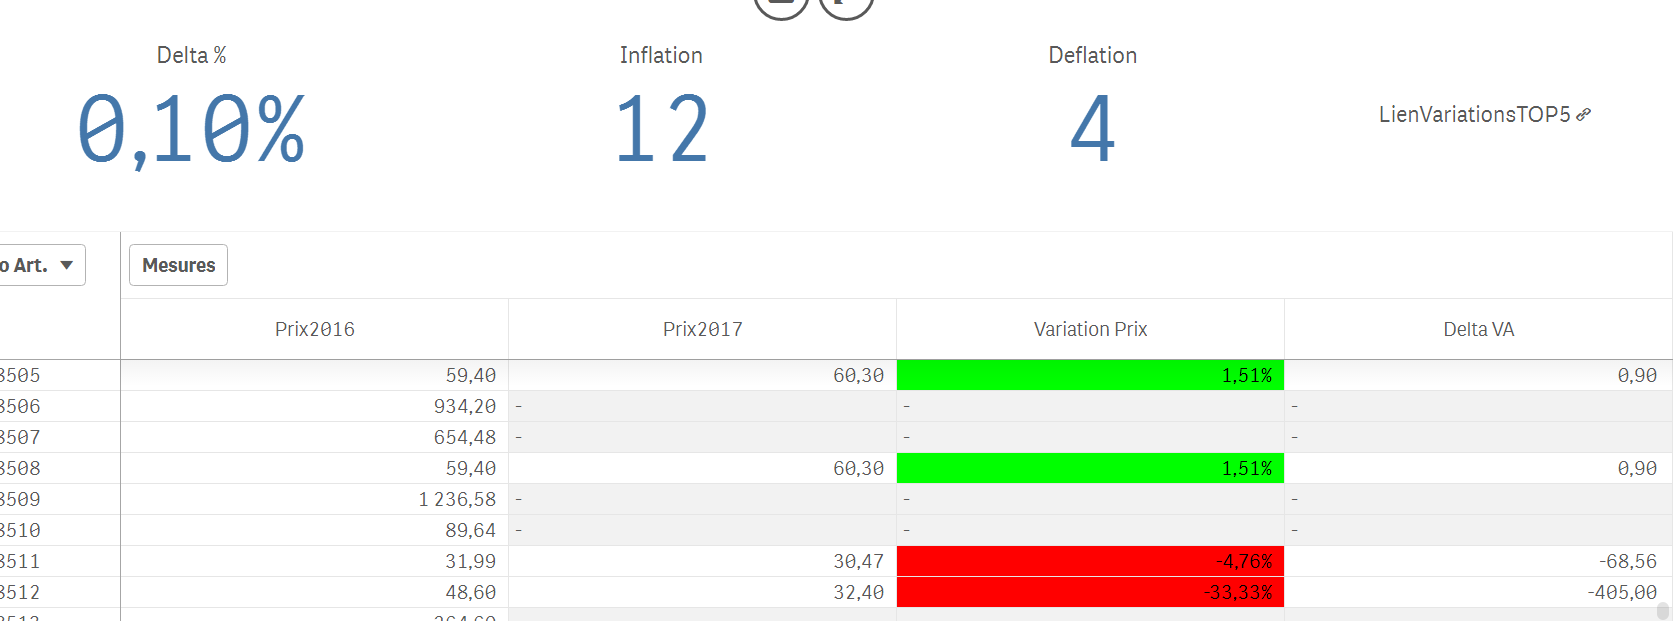
It's the last one on this pic (Delta VA) which equals to Qantity2016*(Price2017-Price2016) so the total amount I have won or lost over one year due to the price movement.
- Mark as New
- Bookmark
- Subscribe
- Mute
- Subscribe to RSS Feed
- Permalink
- Report Inappropriate Content
I have find a way! Thanks for your time and your help
- Mark as New
- Bookmark
- Subscribe
- Mute
- Subscribe to RSS Feed
- Permalink
- Report Inappropriate Content
I am looking for something like you did. the last 5 prices for each item. Just show if the prices change between purchases. ¿Somebody can help me?
- « Previous Replies
-
- 1
- 2
- Next Replies »