Unlock a world of possibilities! Login now and discover the exclusive benefits awaiting you.
- Qlik Community
- :
- Forums
- :
- Analytics
- :
- New to Qlik Analytics
- :
- Re: How to create a drill down column which doesn’...
- Subscribe to RSS Feed
- Mark Topic as New
- Mark Topic as Read
- Float this Topic for Current User
- Bookmark
- Subscribe
- Mute
- Printer Friendly Page
- Mark as New
- Bookmark
- Subscribe
- Mute
- Subscribe to RSS Feed
- Permalink
- Report Inappropriate Content
How to create a drill down column which doesn’t exist in original data
Dear Qlik Sense Expert
I am new to QS and I have a question for drill down
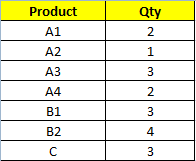
Now I have a table as below and I need to create 2 drill down indicators in Qlik Sense which are ‘A’ & ‘B’
‘A’ & ‘B’ don’t exist in any column of original data
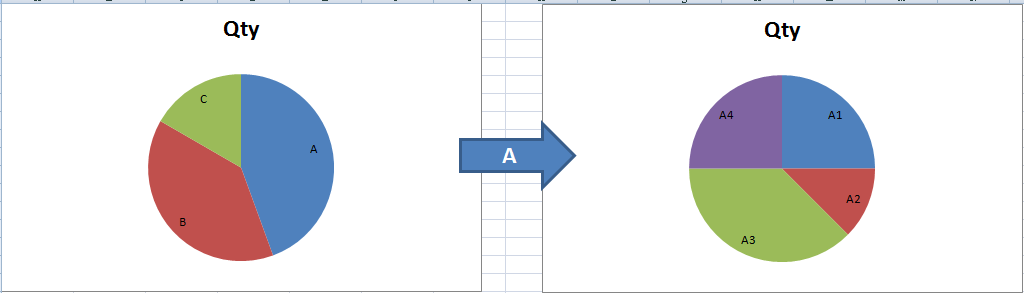
The visualization I need is as below.
- When I click ‘A’, which is the indicator we create in the previous step, the pie will drill down to ‘A1’ ’A2’ ’A3’ ’A4’.
- When I click ‘B’, which is the indicator we create in the previous step, the pie will drill down to ‘B1’ ’B2’.
- ‘C’ is the indicator which exists in the original data
May I know if its workable in Qlik Sense? If so, how to accomplish it?
Thank you for your advise in advance
Ivan
- Mark as New
- Bookmark
- Subscribe
- Mute
- Subscribe to RSS Feed
- Permalink
- Report Inappropriate Content
Cyclic Group : Read below blog post.
Create a Cycle Group in Qlik Sense (without extensions)
Drill Down group
- Mark as New
- Bookmark
- Subscribe
- Mute
- Subscribe to RSS Feed
- Permalink
- Report Inappropriate Content
Kachhia
Thank you for your prompt reply
As I am a front end user thus I don't quite understand the materials you share to me. I can't find connection on them with my case either. Can we do it without writing scripts from back end side?
May I know if its possible for you to do a demo base on my case?
Thanks for your support in advance
Ivan
- Mark as New
- Bookmark
- Subscribe
- Mute
- Subscribe to RSS Feed
- Permalink
- Report Inappropriate Content
See the app attached.
Fei