Unlock a world of possibilities! Login now and discover the exclusive benefits awaiting you.
- Qlik Community
- :
- All Forums
- :
- QlikView App Dev
- :
- Re: In a bar chart how to include one bar at the e...
- Subscribe to RSS Feed
- Mark Topic as New
- Mark Topic as Read
- Float this Topic for Current User
- Bookmark
- Subscribe
- Mute
- Printer Friendly Page
- Mark as New
- Bookmark
- Subscribe
- Mute
- Subscribe to RSS Feed
- Permalink
- Report Inappropriate Content
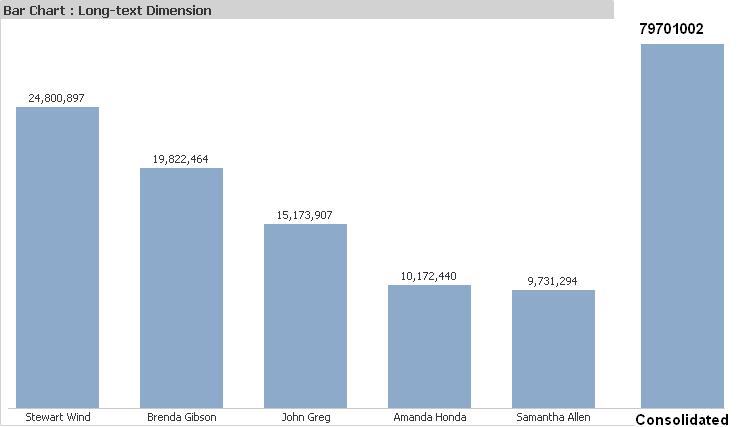
In a bar chart how to include one bar at the end which gives the consolidated value of rest of the chart.
Hi All
May I know how to achieve the following bar chart. For your information 79701002 should get achieved using (24800897+19822464+15173907+10172440+9731294). I want to show the bar at the end of the chart which contains consolidated value of rest of the remaining bar. Please look in to the below figure for better understanding.
Thanks
Attitude
- « Previous Replies
-
- 1
- 2
- Next Replies »
- Mark as New
- Bookmark
- Subscribe
- Mute
- Subscribe to RSS Feed
- Permalink
- Report Inappropriate Content
hi Attitude,
Try this method.
Create a total field at script level and assign zero value to it. Please find the attachment to figure out the rest.
Deepak
- Mark as New
- Bookmark
- Subscribe
- Mute
- Subscribe to RSS Feed
- Permalink
- Report Inappropriate Content
The expression Count(Distinct Field1) / Count(Distinct Field2) will give you a ratio of those two counts. This means that when you tick the 'Show Total' box the bar will show the ratio across all data rather than by dimension. Generally this figure will be more useful that the sum of all the ratios.
In order to get the sum of all the ratios for other dimensions go to the Expressions tab set the Total Mode to be Sum Of Rows. This should then give the value you require.
- Steve
- Mark as New
- Bookmark
- Subscribe
- Mute
- Subscribe to RSS Feed
- Permalink
- Report Inappropriate Content
By the way, in the Data Visualisation demo the value of 80 is showing as the value in Millions. This is because the Million symbol is set on the Number tab. To change this go to this tab and delete the M, K and B from the symbol fields.
- Steve
- « Previous Replies
-
- 1
- 2
- Next Replies »