Unlock a world of possibilities! Login now and discover the exclusive benefits awaiting you.
- Qlik Community
- :
- All Forums
- :
- QlikView App Dev
- :
- Stacked Bar Chart Issues
- Subscribe to RSS Feed
- Mark Topic as New
- Mark Topic as Read
- Float this Topic for Current User
- Bookmark
- Subscribe
- Mute
- Printer Friendly Page
- Mark as New
- Bookmark
- Subscribe
- Mute
- Subscribe to RSS Feed
- Permalink
- Report Inappropriate Content
Stacked Bar Chart Issues
Hello,
I am attempting to create a stacked bar chart with 2 dimensions and 1 expression. The dimensions are post dates in YYYYMM format and insurance payers. Ideally I would like to show the top 5 payors ranked by the expression that follows with an Other category that all other payers get bucketed into. The expression is transaction amounts as a percentage of gross charges:
=num(Sum(tx_amount)*(-1)/Sum(gc_hb_tot_chg),'#,##0.00%')
Below is the chart without the payor_name dimension:
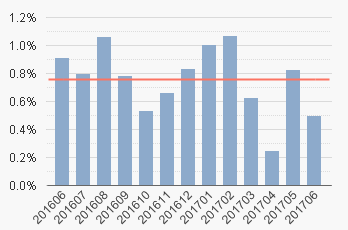
When I add the payor name the chart gets all kinds of funky and I suspect it has something to do with my expression. Additionally there are 8 listed payors instead of the specified 5 in the limits tab for payor_name.
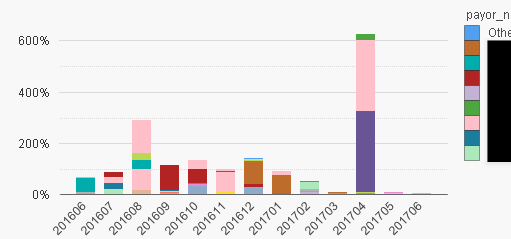
I'm hoping I can get the chart to have the same total % values for each month show by the first blue chart but to break it down by payor, and potentially other dimensions as well in a separate chart. I could be totally wrong but I have a hunch that ValueList() is where my answer lies as referenced in this discussion (Stacked bar chart not working properly - all parts are equal)but I am not sure how to apply it to this scenario.
Thank you!