Unlock a world of possibilities! Login now and discover the exclusive benefits awaiting you.
- Qlik Community
- :
- All Forums
- :
- QlikView App Dev
- :
- Re: Help with displaying current details
- Subscribe to RSS Feed
- Mark Topic as New
- Mark Topic as Read
- Float this Topic for Current User
- Bookmark
- Subscribe
- Mute
- Printer Friendly Page
- Mark as New
- Bookmark
- Subscribe
- Mute
- Subscribe to RSS Feed
- Permalink
- Report Inappropriate Content
Help with displaying current details
Hi, i am creating an application to show current stock levels for all products in all of our retail stores.
I am trying to show this information in a straight table. I have a couple of date fields which i need to use
StoreDate (which is the date the record was created)
LastSoldDate (which is the date the product was last sold)
Data comes in every night from each store and is processed early hours each morning, which means that in the space of a week, there will be 7 records per product, all with a different StoreDate and most with a different LastSoldDate.
When i try and create this chart, several lines appear per product (as it obviously shows any record processed for that product/store. I only want the chart to show the most CURRENT record.
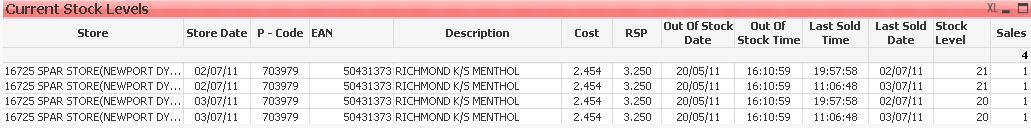
In the example below, there are 4 lines for the same product. The 4 records have 2 different StoreDates and each different StoreDate has 2 different LastSoldDates.
I only want the chart to display the latest StoreDate with the latest LastSoldDate (The bottom line in this example)
But i also need it to do something else. I need it to completely ignore any date selection (i have attached a QV doc, the dates selections are on the top row) but i want it to accept any other selection (from the left hand side.. customer, product etc)
Can anyone help me with this please?
- Tags:
- new_to_qlikview
- « Previous Replies
-
- 1
- 2
- Next Replies »
- Mark as New
- Bookmark
- Subscribe
- Mute
- Subscribe to RSS Feed
- Permalink
- Report Inappropriate Content
Hi Miguel, thanks for that. When i copy it into an expression, the Date part of it "Sum({< Date = {'>=$(=AddMonths"
is underlined red. Should this be my date field (StoreDate). And i don't know if im being stupid  but what do you mean by...
Instead of using the field to be shown, use an aggregation function.
Sorry, i'm not the best on set analysis and expressions! 
- Mark as New
- Bookmark
- Subscribe
- Mute
- Subscribe to RSS Feed
- Permalink
- Report Inappropriate Content
Hi,
What I mean is that in the original expression, you were using "SalesQuantity" at the end of the expression. That shows only the value of that field for the aggregation (last sold date, last store date).
So instead of coding only the name of the field, code the Sum() of the SalesQuantity values for the last 30 days, which is what I proposed above:
Sum({< StoreDate = {'>=$(=AddMonths(Date, -1))'} >} SalesQuantity)
By the way yes, it should be StoreDate or the date field you want to get the last 30 days of sales.
Hope that helps.
BI Consultant
- Mark as New
- Bookmark
- Subscribe
- Mute
- Subscribe to RSS Feed
- Permalink
- Report Inappropriate Content
Thanks for all your help Miguel, It's very much appreciated
- Mark as New
- Bookmark
- Subscribe
- Mute
- Subscribe to RSS Feed
- Permalink
- Report Inappropriate Content
Sorry again, I am struggling with my chart. All you have thelped me with so far worked great as i was only testing it for ONE product. I have just tried viewing ALL products for a specific store, but it only show's me ONE (The latest StoreDate and latest LastSoldDate). I need it to show every product, but where there are multiple entries for the same product that's where i would want the expression to kick in and only show the latest product.
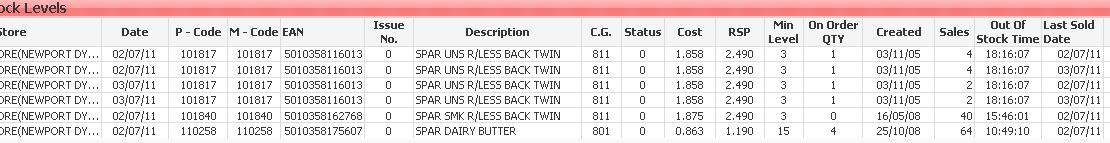
The top 3 above should be hidden, as the 4th in the list is the latest one.
Any ideas?
- Mark as New
- Bookmark
- Subscribe
- Mute
- Subscribe to RSS Feed
- Permalink
- Report Inappropriate Content
Hi,
You will need to add those fields to the Aggr() function. In this case I was aggregating by StoreNumber as you can see in the code above, so try replacing with the following instead
FirstSortedValue(If(Aggr(Max(LastSoldDate), StoreNumber, ProductNumber) = LastSoldDate, LastSoldDate), -StoreDate)
Change "ProductNumber" by your actual product code number field name.
Hope that helps.
BI Consultant
- Mark as New
- Bookmark
- Subscribe
- Mute
- Subscribe to RSS Feed
- Permalink
- Report Inappropriate Content
Hi Miguel, Yes i tried this just after i asked for your help again and it worked great. I changed all expressions to include the extra dimensions and it gave me the result i was looking for.
Thanks again for all your help
The people using Qlik Community are so helpful
- Mark as New
- Bookmark
- Subscribe
- Mute
- Subscribe to RSS Feed
- Permalink
- Report Inappropriate Content
Miguel, this i sthe last time i bother you i promise
Just wondering how the expression works which you gave me for the last 4 weeks average sales
If(FirstSortedValue(If(Aggr(Max(LastSoldDate),[Product Code],StoreNumber) = LastSoldDate, LastSoldDate), -StoreDate) = StoreDate, sum({< StoreDate = {'>=$(=AddMonths(StoreDate, -1))'} >}SalesQuantity))
I can see that this expression adds in the last months worth of sales. How would i get just the last 28 days instead of month? and i would like it to be the last 4 FULL weeks, i.e. Mon-Sun. So if i used the app today (8/7/11), it would give me the average sales between 6th June - 3rd June.
Is this too awkward?
- Mark as New
- Bookmark
- Subscribe
- Mute
- Subscribe to RSS Feed
- Permalink
- Report Inappropriate Content
Dates are numeric values in QlikView, so you can substract to the date field 28 units (days). So something like the following should work:
Sum({< StoreDate = {'>=$(=Date(StoreDate -28))'} >} SalesQuantity)
Hope that helps.
BI Consultant
- Mark as New
- Bookmark
- Subscribe
- Mute
- Subscribe to RSS Feed
- Permalink
- Report Inappropriate Content
Thanks very much i will leave you alone now
- « Previous Replies
-
- 1
- 2
- Next Replies »