Unlock a world of possibilities! Login now and discover the exclusive benefits awaiting you.
- Qlik Community
- :
- Forums
- :
- Analytics
- :
- New to Qlik Analytics
- :
- Re: How to do Human fill graph in qlik sense?
- Subscribe to RSS Feed
- Mark Topic as New
- Mark Topic as Read
- Float this Topic for Current User
- Bookmark
- Subscribe
- Mute
- Printer Friendly Page
- Mark as New
- Bookmark
- Subscribe
- Mute
- Subscribe to RSS Feed
- Permalink
- Report Inappropriate Content
How to do Human fill graph in qlik sense?
Hi All,
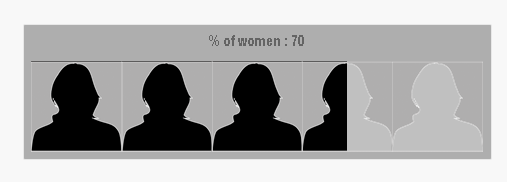
How to do Human fill graph in qlik sense? Example see below screen...
Thanks,
Sateesh.
- Mark as New
- Bookmark
- Subscribe
- Mute
- Subscribe to RSS Feed
- Permalink
- Report Inappropriate Content
Hi Sateesh,
if you have this fill graph as extension, you should save it in folder: Extension withion your Qlik Sense, but one more little thing for you: Qlik Sense has an default extension called: People Chart (Extension), maybe this chart suits better to your issue. (please see attached screenshot)
i hope that helps
Beck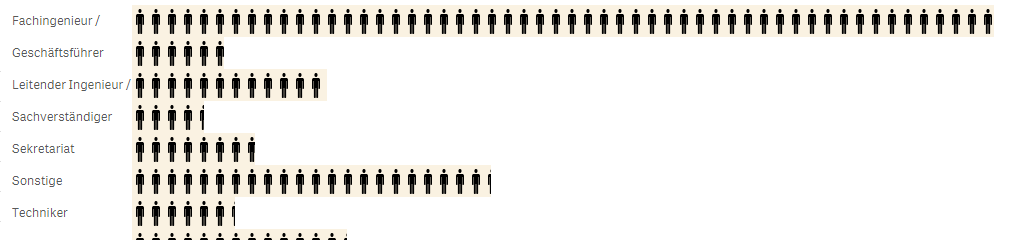
- Mark as New
- Bookmark
- Subscribe
- Mute
- Subscribe to RSS Feed
- Permalink
- Report Inappropriate Content
Hi Beck,
We can use that extension but I think there is a problem i.e. No of human images will be displayed as per the size of the object and there is no show value kind of option. If the user wants to know the value, he/she has to hover the mouse on to that chart.
I'm not sure how it is working now but I tried it couple of months ago.
Thanks & Regards,
Prashanth Reddy D.
- Mark as New
- Bookmark
- Subscribe
- Mute
- Subscribe to RSS Feed
- Permalink
- Report Inappropriate Content
Thanks for your inputs..
I have a value like score if score will increase automatically it has fill that image like black otherwise light grey...
Thanks,
Sateesh.