Unlock a world of possibilities! Login now and discover the exclusive benefits awaiting you.
- Qlik Community
- :
- All Forums
- :
- QlikView App Dev
- :
- Re: Load previous week data as additional column
- Subscribe to RSS Feed
- Mark Topic as New
- Mark Topic as Read
- Float this Topic for Current User
- Bookmark
- Subscribe
- Mute
- Printer Friendly Page
- Mark as New
- Bookmark
- Subscribe
- Mute
- Subscribe to RSS Feed
- Permalink
- Report Inappropriate Content
Load previous week data as additional column
Hi all!
I have a problem that I was trying to solve for a few days, but still cannot get it correct when I load data.
I have current table like this:
Opportunity No | Opp. Value | Script Execution Date | Script Execution Week |
123 | 1000 | 2017-7-1 | 2017-26 |
123 | 1200 | 2017-7-8 | 2017-27 |
123 | 1300 | 2017-7-15 | 2017-28 |
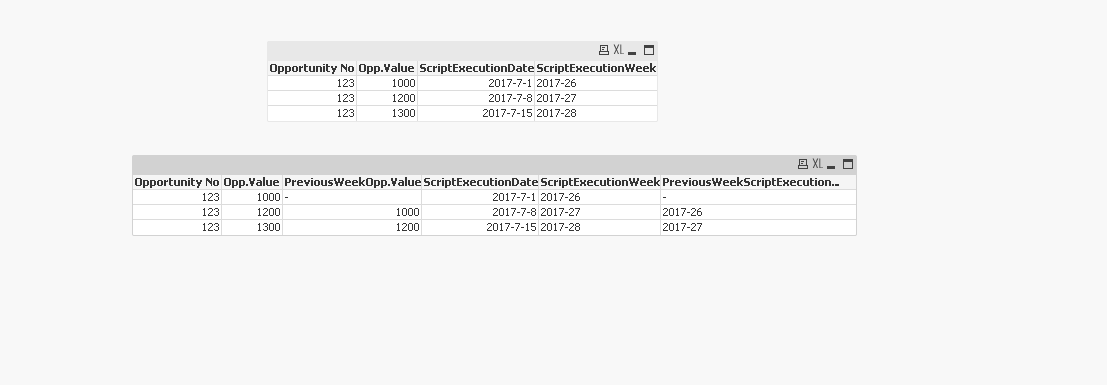
I would like to have a table loaded like this:
Opportunity No | Opp. Value | Previous Week Opp Value | Script Execution Date | Script Execution Week | Prev Script Execution Week |
123 | 1000 | null | 2017-7-1 | 2017-26 | 2017-25 |
123 | 1200 | 1000 | 2017-7-8 | 2017-27 | 2017-26 |
123 | 1300 | 1200 | 2017-7-15 | 2017-28 | 2017-27 |
I have all figured out, except how to load “Previous Week Opp Value”.
For some reason I am stuck with it :/, and it really should not be that difficult… I would appreciate any suggestion.
Thank you!!
Accepted Solutions
- Mark as New
- Bookmark
- Subscribe
- Mute
- Subscribe to RSS Feed
- Permalink
- Report Inappropriate Content
Hi Gordana
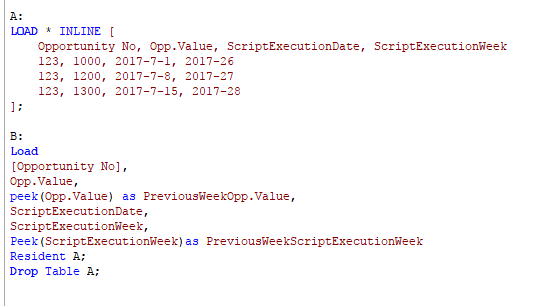
This script will work as long as the data is loaded in date order:
Data:
LOAD [Opportunity No],
[Opp. Value],
Previous([Opp. Value]) as [Previous Week Opp Value],
Date([Script Execution Date],'YYYY-M-D') as [Script Execution Date],
Year(Date([Script Execution Date],'YYYY-M-D')) & '-' & Week(Date([Script Execution Date],'YYYY-M-D')) as [Script Execution Week],
Year(Date([Script Execution Date],'YYYY-M-D')-7) & '-' & Week(Date([Script Execution Date],'YYYY-M-D')-7) as [Prev Script Execution Week]
FROM
Book1.xlsx
(ooxml, embedded labels, table is Sheet1);
OR
You can keep the script really simple:
Data:
LOAD [Opportunity No],
[Opp. Value],
Date([Script Execution Date],'YYYY-M-D') as [Script Execution Date]
FROM
Book1.xlsx
(ooxml, embedded labels, table is Sheet1);
and use chart expressions:
| Opportunity No | Opp. Value | Previous Week Opp Value | Script Execution Date | Script Execution Week | Prev Script Execution Week |
|---|---|---|---|---|---|
| 123 | 1000 | 2017-7-1 | 2017-26 | 2017-25 | |
| 123 | 1200 | 1000 | 2017-7-8 | 2017-27 | 2017-26 |
| 123 | 1300 | 1200 | 2017-7-15 | 2017-28 | 2017-27 |
Dimensions are [Opportunity No] and [Script Execution Date]
Expressions:
Opp. Value = sum([Opp. Value])
Previous Week Opp Value = Above(TOTAL sum([Opp. Value]))
Script Execution Week =
Year(Date([Script Execution Date],'YYYY-M-D')) & '-' & Week(Date([Script Execution Date],'YYYY-M-D'))
Prev Script Execution Week=
Year(Date([Script Execution Date],'YYYY-M-D')-7) & '-' & Week(Date([Script Execution Date],'YYYY-M-D')-7)
Regards
Andrew
- Mark as New
- Bookmark
- Subscribe
- Mute
- Subscribe to RSS Feed
- Permalink
- Report Inappropriate Content
Just to add the Load script:
Load Opportunity_No,
Opp_Value,
Script_Execution_Date,
Script_Execution_Week,
If(week(Script_Execution_Date)=1, Year(Script_Execution_Date)-1 & '-' & week(Script_Execution_Date - 7), Year(Script_Execution_Date) & '-' & week(Script_Execution_Date - 7)) as Previous_Script_Execution_Week;
- Mark as New
- Bookmark
- Subscribe
- Mute
- Subscribe to RSS Feed
- Permalink
- Report Inappropriate Content
Please look at the attached qvw.
- Mark as New
- Bookmark
- Subscribe
- Mute
- Subscribe to RSS Feed
- Permalink
- Report Inappropriate Content
Hi Mouna,
I will take a look at this and try to apply to my Load script. I have Qlik Sense so I cannot open the file you have attached as your solution. I will let you know if it works.
Thanks!
- Mark as New
- Bookmark
- Subscribe
- Mute
- Subscribe to RSS Feed
- Permalink
- Report Inappropriate Content
Hi Gordana
This script will work as long as the data is loaded in date order:
Data:
LOAD [Opportunity No],
[Opp. Value],
Previous([Opp. Value]) as [Previous Week Opp Value],
Date([Script Execution Date],'YYYY-M-D') as [Script Execution Date],
Year(Date([Script Execution Date],'YYYY-M-D')) & '-' & Week(Date([Script Execution Date],'YYYY-M-D')) as [Script Execution Week],
Year(Date([Script Execution Date],'YYYY-M-D')-7) & '-' & Week(Date([Script Execution Date],'YYYY-M-D')-7) as [Prev Script Execution Week]
FROM
Book1.xlsx
(ooxml, embedded labels, table is Sheet1);
OR
You can keep the script really simple:
Data:
LOAD [Opportunity No],
[Opp. Value],
Date([Script Execution Date],'YYYY-M-D') as [Script Execution Date]
FROM
Book1.xlsx
(ooxml, embedded labels, table is Sheet1);
and use chart expressions:
| Opportunity No | Opp. Value | Previous Week Opp Value | Script Execution Date | Script Execution Week | Prev Script Execution Week |
|---|---|---|---|---|---|
| 123 | 1000 | 2017-7-1 | 2017-26 | 2017-25 | |
| 123 | 1200 | 1000 | 2017-7-8 | 2017-27 | 2017-26 |
| 123 | 1300 | 1200 | 2017-7-15 | 2017-28 | 2017-27 |
Dimensions are [Opportunity No] and [Script Execution Date]
Expressions:
Opp. Value = sum([Opp. Value])
Previous Week Opp Value = Above(TOTAL sum([Opp. Value]))
Script Execution Week =
Year(Date([Script Execution Date],'YYYY-M-D')) & '-' & Week(Date([Script Execution Date],'YYYY-M-D'))
Prev Script Execution Week=
Year(Date([Script Execution Date],'YYYY-M-D')-7) & '-' & Week(Date([Script Execution Date],'YYYY-M-D')-7)
Regards
Andrew
- Mark as New
- Bookmark
- Subscribe
- Mute
- Subscribe to RSS Feed
- Permalink
- Report Inappropriate Content
Thank you so much! It worked great, that is exactly what I needed! 
- Mark as New
- Bookmark
- Subscribe
- Mute
- Subscribe to RSS Feed
- Permalink
- Report Inappropriate Content
Hi Gordana,
Really pleased to have helped! 