Unlock a world of possibilities! Login now and discover the exclusive benefits awaiting you.
- Qlik Community
- :
- Forums
- :
- Analytics
- :
- New to Qlik Analytics
- :
- Re: Qlik Sense - show remark on chart
Options
- Subscribe to RSS Feed
- Mark Topic as New
- Mark Topic as Read
- Float this Topic for Current User
- Bookmark
- Subscribe
- Mute
- Printer Friendly Page
Turn on suggestions
Auto-suggest helps you quickly narrow down your search results by suggesting possible matches as you type.
Showing results for
Contributor III
2017-07-27
10:03 PM
- Mark as New
- Bookmark
- Subscribe
- Mute
- Subscribe to RSS Feed
- Permalink
- Report Inappropriate Content
Qlik Sense - show remark on chart
Dear Community,
Is it possible to show remark on chart?
Attached qvf and excel.
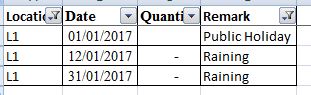
for example:
when i filter
01/01/2017, location L1, show Public Holiday
21/01/2017, Location L1 show Raining
3 Replies
Creator II
2017-07-28
11:50 AM
- Mark as New
- Bookmark
- Subscribe
- Mute
- Subscribe to RSS Feed
- Permalink
- Report Inappropriate Content
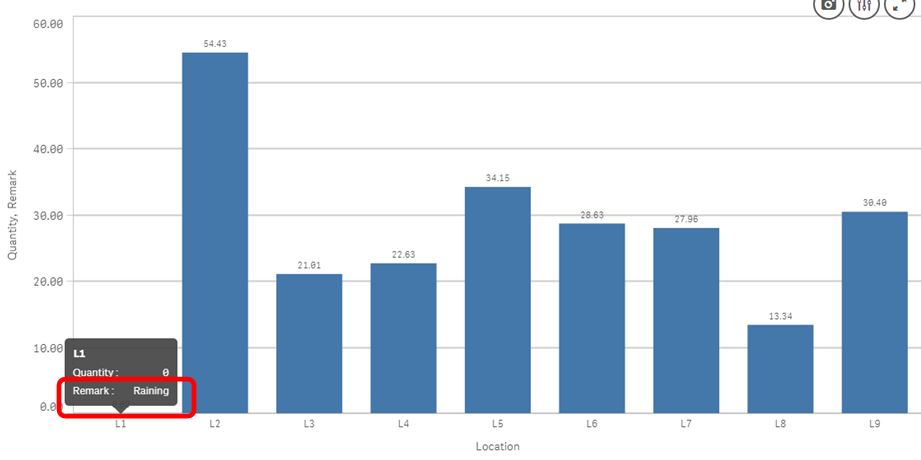
So, when I'm selecting L1 Location then my quantity will be 0 means Only L1 bar will be there with 0 quantity and Remark will be Public holiday and Raining...Is it like that?
MVP
2017-07-28
01:17 PM
- Mark as New
- Bookmark
- Subscribe
- Mute
- Subscribe to RSS Feed
- Permalink
- Report Inappropriate Content
Just color by dimension 'remark':
Contributor III
2017-07-30
10:08 PM
Author
- Mark as New
- Bookmark
- Subscribe
- Mute
- Subscribe to RSS Feed
- Permalink
- Report Inappropriate Content
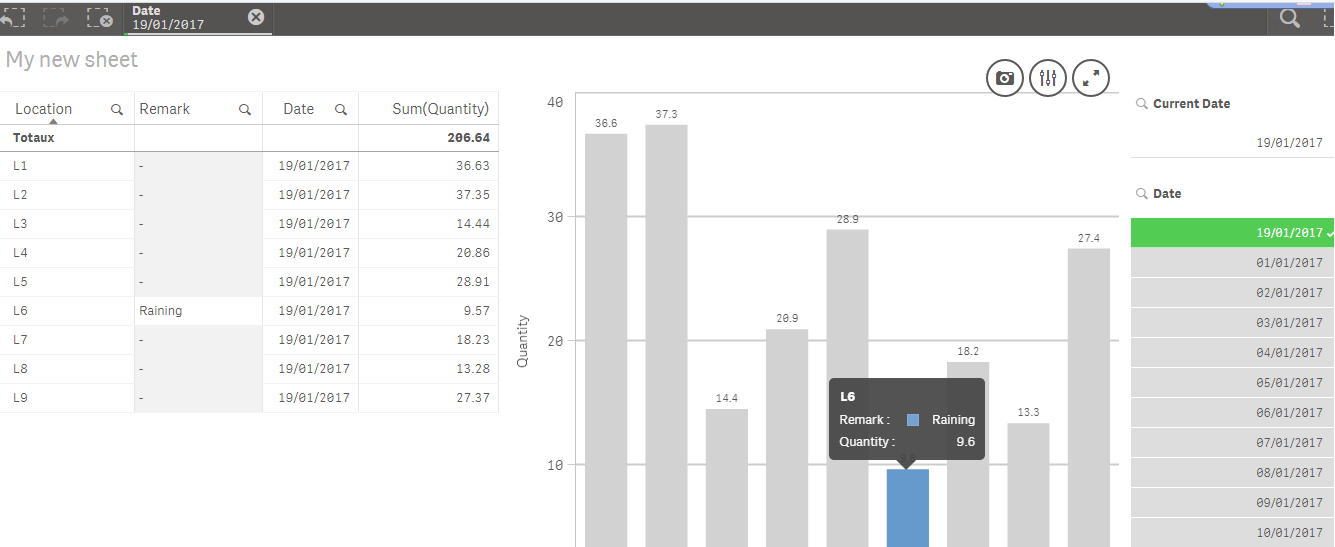
Thanks, manage to do it
SET vCurrentDate= =Date(Max([Date]),'DD/MM/YYYY');
Quantity Expression
Sum({<[Date]={'$(vCurrentDate)'} >}Quantity)
Remark Expression
Text(only({<Date={"$(=vCurrentDate)"}>} Remark))
320 Views
Community Browser