Unlock a world of possibilities! Login now and discover the exclusive benefits awaiting you.
- Qlik Community
- :
- Forums
- :
- Analytics
- :
- New to Qlik Analytics
- :
- Re: Slider to select a field
- Subscribe to RSS Feed
- Mark Topic as New
- Mark Topic as Read
- Float this Topic for Current User
- Bookmark
- Subscribe
- Mute
- Printer Friendly Page
- Mark as New
- Bookmark
- Subscribe
- Mute
- Subscribe to RSS Feed
- Permalink
- Report Inappropriate Content
Slider to select a field
Hi Experts,
I am trying to create a slider in Qliksense which will select the values in a field.
I have an 'Hour' field in my table which has values ranging from 0 to 23.
Now, i need to create a slider with this Hour values 0 to 23.
whenever i move the slider to a value, it should select 'Hour' field and this selection should impact the other charts in my sheet.
Is it possible? If so, can you please guide me on how to do this?
- « Previous Replies
-
- 1
- 2
- Next Replies »
Accepted Solutions
- Mark as New
- Bookmark
- Subscribe
- Mute
- Subscribe to RSS Feed
- Permalink
- Report Inappropriate Content
Hi Rajendran,
I don't think you use the right extension, Please follow my link above.
I have attached the sample file with your desired output.
Many Thanks
Karthik
- Mark as New
- Bookmark
- Subscribe
- Mute
- Subscribe to RSS Feed
- Permalink
- Report Inappropriate Content
Hi Rajendran,
You can use this extension for variable slider.
http://branch.qlik.com/#!/project/56728f52d1e497241ae697f8
Include that variable value in your formula.
Many Thanks
Karthik
- Mark as New
- Bookmark
- Subscribe
- Mute
- Subscribe to RSS Feed
- Permalink
- Report Inappropriate Content
i have this extension already.
but i dont know how to achieve my requirement.
can you please explain it step by step?
also, can you please explain how to include that variable value if my expression in a chart is sum(sales)
- Mark as New
- Bookmark
- Subscribe
- Mute
- Subscribe to RSS Feed
- Permalink
- Report Inappropriate Content
hi,
use expression as "sum({<Hour={'$(vHour_var)'}>}sales)" where "vHour_var" will be your variable..
now in slider set data value as an variable then min and max value will be 0 and 23 respectively.
you will get what you want as an output.
Thanks
Mayuresh
- Mark as New
- Bookmark
- Subscribe
- Mute
- Subscribe to RSS Feed
- Permalink
- Report Inappropriate Content
Hi Mayuresh,
I tried the way as you said but it is not working.
i have attached the sample qvf which i m working on.
If you please correct it on this sample that would be great.
- Mark as New
- Bookmark
- Subscribe
- Mute
- Subscribe to RSS Feed
- Permalink
- Report Inappropriate Content
Hi Rajendran,
I don't think you use the right extension, Please follow my link above.
I have attached the sample file with your desired output.
Many Thanks
Karthik
- Mark as New
- Bookmark
- Subscribe
- Mute
- Subscribe to RSS Feed
- Permalink
- Report Inappropriate Content
Hi Karthik,
Thank you so much.
i did the same way in my original app. but the charts are displaying values only when the slider is set above 10.
but there is data even for Hour 0. i dont know what i m doing wrong. please help
can you please tell me why the variable is defined as sum(1)? reason?
- Mark as New
- Bookmark
- Subscribe
- Mute
- Subscribe to RSS Feed
- Permalink
- Report Inappropriate Content
The example of karthikoffi27sep worked for me:
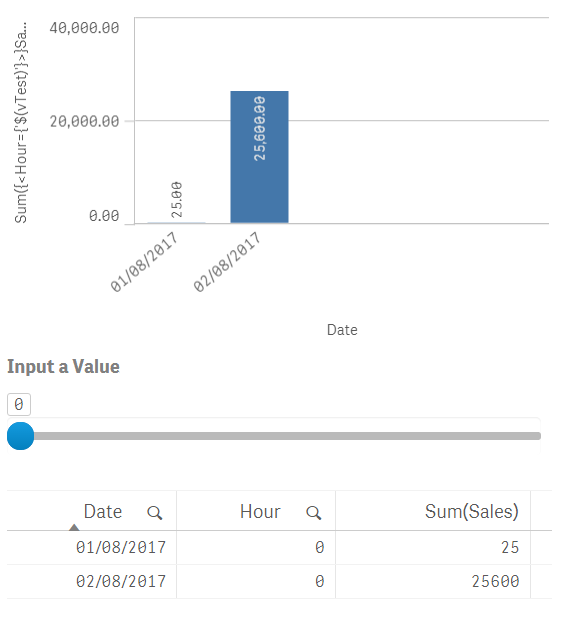
I've added a table with:
- Dimension:
- Date
- Hour
- Measure:
- sum(Sales)
- Order by:
- Date
- Hour
- Sum(Sales)
I've checked the 'Slider Label' option in the object of qsVariable extension
- Mark as New
- Bookmark
- Subscribe
- Mute
- Subscribe to RSS Feed
- Permalink
- Report Inappropriate Content
Yes it is working in that example.
but not in my actual app. the charts are displayed only if the slider value is above 10 which is wrong.
there should be some data even if the slider is 0
- Mark as New
- Bookmark
- Subscribe
- Mute
- Subscribe to RSS Feed
- Permalink
- Report Inappropriate Content
Can you share some code or screenshot?
That's a strange behaviour if there is no condition somewhere
- « Previous Replies
-
- 1
- 2
- Next Replies »