Unlock a world of possibilities! Login now and discover the exclusive benefits awaiting you.
- Qlik Community
- :
- All Forums
- :
- QlikView App Dev
- :
- Re: Hierarchy display
- Subscribe to RSS Feed
- Mark Topic as New
- Mark Topic as Read
- Float this Topic for Current User
- Bookmark
- Subscribe
- Mute
- Printer Friendly Page
- Mark as New
- Bookmark
- Subscribe
- Mute
- Subscribe to RSS Feed
- Permalink
- Report Inappropriate Content
Hierarchy display
Hi
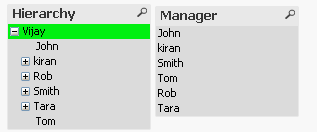
I have one data model table Hierarchy and its column has been used in list box filter. We have one chart which uses Manager as dimension.
Current behavior of this chart when any value selected in filter
1. Click on Vijay and this shows all managers under him in  mode.
mode.
But I would like to display only his Immediate manager's info only
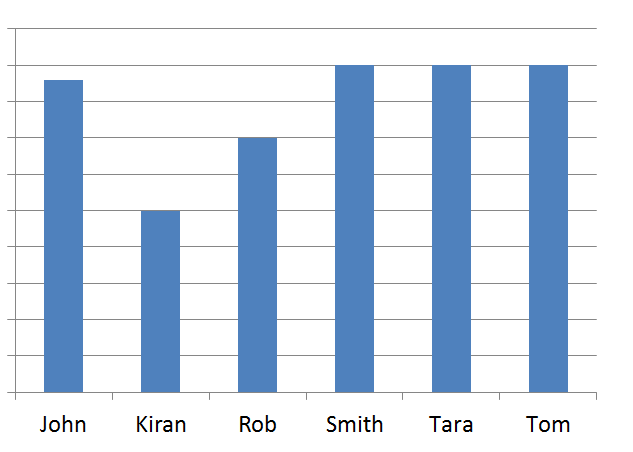
John, Kiran, Rob, Smith, Tara, Tom
This works fine when I click Kiran, Rob,Smith and Tara in mode. This only display their managers only.
How can I get the below presentation when I click on Vijay?
I have attached Qvw and excel file for data . Please suggest me what can I do to achieve this
- Mark as New
- Bookmark
- Subscribe
- Mute
- Subscribe to RSS Feed
- Permalink
- Report Inappropriate Content
Like this? you are trying to achieve in Bar graph
- Mark as New
- Bookmark
- Subscribe
- Mute
- Subscribe to RSS Feed
- Permalink
- Report Inappropriate Content
Yes Anil ..Similar way.. How can we do this?
- Mark as New
- Bookmark
- Subscribe
- Mute
- Subscribe to RSS Feed
- Permalink
- Report Inappropriate Content
I did it like to get Manager. But, Informative is not correct because associative engine is not getting in your Data.
SubField(Hierarchy, '/', 2)
The possible solution may be this?
Sum({<Hierarchy = $:: Manager >} Measure)
OR
Sum({<Hierarchy = P(Manager) >} Measure)
- Mark as New
- Bookmark
- Subscribe
- Mute
- Subscribe to RSS Feed
- Permalink
- Report Inappropriate Content
Please check this to achieve your output.