Unlock a world of possibilities! Login now and discover the exclusive benefits awaiting you.
- Qlik Community
- :
- All Forums
- :
- QlikView App Dev
- :
- Percent of Average
- Subscribe to RSS Feed
- Mark Topic as New
- Mark Topic as Read
- Float this Topic for Current User
- Bookmark
- Subscribe
- Mute
- Printer Friendly Page
- Mark as New
- Bookmark
- Subscribe
- Mute
- Subscribe to RSS Feed
- Permalink
- Report Inappropriate Content
Percent of Average
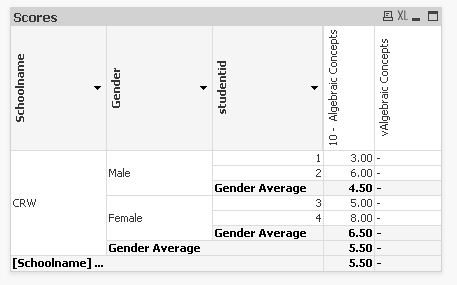
All I have create the following pivot table. I Need to add a row which calculates the percentage of the gender average and school average. The average is based on the average divided by 10. therefore male percentage = 45% and female percentage= 55% school percentage =55%
Percentage should display below average. Can someone help me do this?
- Mark as New
- Bookmark
- Subscribe
- Mute
- Subscribe to RSS Feed
- Permalink
- Report Inappropriate Content
Hi there - I am not sure I follow how you can turn the average into a percentage like that, but you can get a percentage figure by adding a new expression with the calculation for percentage in. You then need to define on the Number tab that it is a percentage (rather than a decimal) with the Percentage tick box. This will then add another column for the percentages and show them alongside your averages (rather than underneath), but that is how the Pivot display works.
- Steve
- Mark as New
- Bookmark
- Subscribe
- Mute
- Subscribe to RSS Feed
- Permalink
- Report Inappropriate Content
Can I achieve the same view using something other than a pivot table?
- Mark as New
- Bookmark
- Subscribe
- Mute
- Subscribe to RSS Feed
- Permalink
- Report Inappropriate Content
You can get more flexibility with a straight table and multiple expressions. What you will not be able to acheive that way though is the grouped dimensions - like you have CRW in your example.
What you may need to look at is the SecondaryDimensionality function to have a different expression based on whether it is in a Pivot total cell or not. What you will not be able to do with this though is have a different number format in the dimension cells to the total cells.
- Steve
- Mark as New
- Bookmark
- Subscribe
- Mute
- Subscribe to RSS Feed
- Permalink
- Report Inappropriate Content
Can you walk me through the first scenario I am a newbie. Thanks
- Mark as New
- Bookmark
- Subscribe
- Mute
- Subscribe to RSS Feed
- Permalink
- Report Inappropriate Content
The straight table approach would be fiddly at best to describe.
Your best bet is probably to have the Pivot as you presently have with two expressions. One with the values as you have them, and the other with the percentage. You can then hide the percentages from the cells that are not totals by setting the text colour of non-total cells to white on the percentages.
To do this create both expressions, then click the plus next to the Percentage expression, select Text Colour then copy and paste the following into the Definition box:
=if(SecondaryDimensionality() = 1 and Dimensionality() = 1, white(), null())
Hope that helps.
Steve