Unlock a world of possibilities! Login now and discover the exclusive benefits awaiting you.
- Qlik Community
- :
- Forums
- :
- Analytics
- :
- New to Qlik Analytics
- :
- Re: Calculating average
- Subscribe to RSS Feed
- Mark Topic as New
- Mark Topic as Read
- Float this Topic for Current User
- Bookmark
- Subscribe
- Mute
- Printer Friendly Page
- Mark as New
- Bookmark
- Subscribe
- Mute
- Subscribe to RSS Feed
- Permalink
- Report Inappropriate Content
Calculating average
I have a set of tree inventory data that includes information on the condition of each tree and looks something like this:
TreeID Species Condition
Tree1 Oak Good
Tree2 Oak Poor
Tree3 Oak Good
Tree4 Maple Good
Tree5 Maple Poor
I have an associated table that correlates the condition word to a condition score (number), like this:
Dead 0
Critical 2
Poor 4
Fair 6
Good 8
Very good 9
Excellent 10
I want to calculate the average condition score across all the trees in the inventory, but instead I keep getting an average of the seven condition scores. So for my 125,000 trees, I get an average condition score of 5.57, which is actually the average of (0+2+4+6+8+9+10)/7.
As a further example, if I did Sum(Condition score) for the above example, I would get 12 (4 [score for poor] + 8 [score for good]) and I want to get 28 (8+4+8+8+4).
As I'm very new to this, I'm grateful for any help! Thanks so much.
~Kelaine
Accepted Solutions
- Mark as New
- Bookmark
- Subscribe
- Mute
- Subscribe to RSS Feed
- Permalink
- Report Inappropriate Content
I think I figured it out. It does seem, when doing avg([Condition score]), it is always averaging within the table the field is found - Conditions. To average the condition score of your Trees inventory, you'd have to do one of two things:
1. Load the data such that the condition score is part of the Trees table. Then use avg([Condition score]) and it should work. Yes, you'd be denormalizing and wouldn't need to load the Conditions table as a dimension table.
OR
2. Keep the setup you have now and change your expression to this:
avg(aggr(sum([Condition score]), [TreeID]))
By using the aggr() function, you'd first force QlikSense to sum the condition scores across the Trees data. In order for it to work correctly, the 2nd argument for aggr() has to be a field in Trees that is unique to each row. It seems TreeID will serve that purpose.
After aggr() gets the total condition score for all trees, then it will be averaged.
- Mark as New
- Bookmark
- Subscribe
- Mute
- Subscribe to RSS Feed
- Permalink
- Report Inappropriate Content
Kelaine, would you mind uploading your .qvw so I can help? I need to see how tables are linked, and how you created your chart's expressions. What you're trying to do sounds simple enough, so I think the issue is more than just creating the formula for the expression. I can't recommend anything without seeing the whole picture. Thanks.
- Mark as New
- Bookmark
- Subscribe
- Mute
- Subscribe to RSS Feed
- Permalink
- Report Inappropriate Content
Craig,
I appreciate the quick response!
I'm using the personal version of Qlik Sense Cloud, so I don't think I have the capacity to create a .gvw file, right? I've attached a screenshot of the table associations, although I expect that doesn't help much.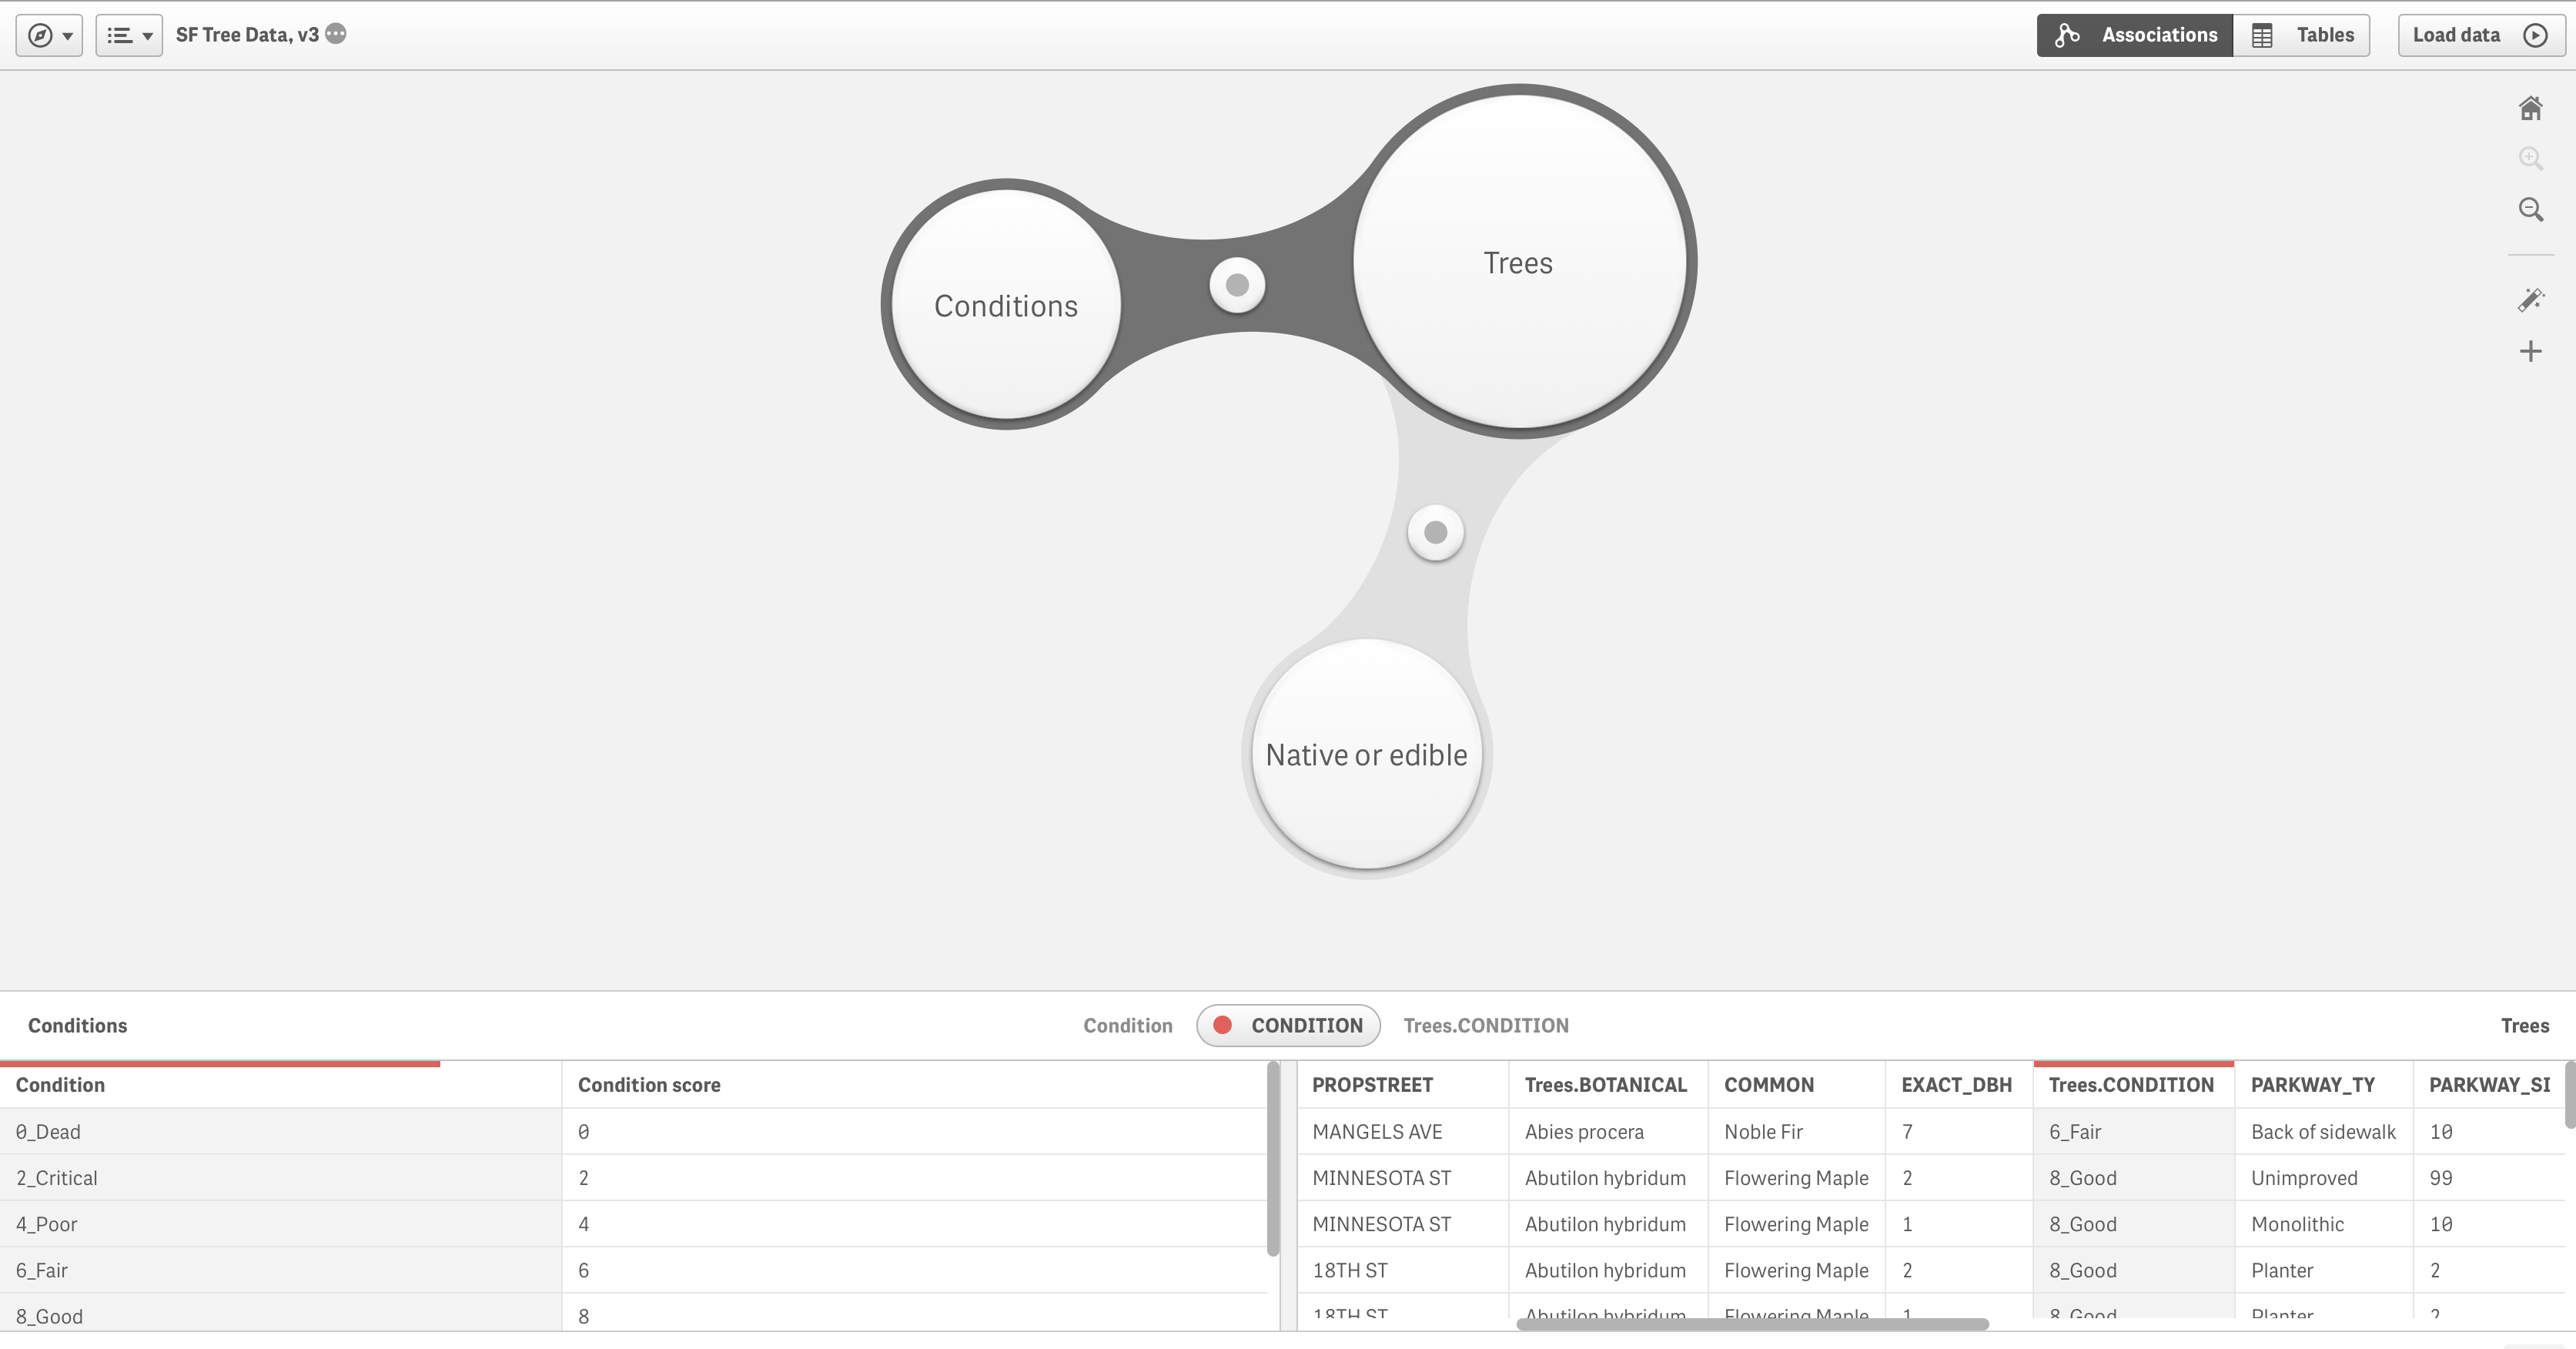
Thanks,
Kelaine
- Mark as New
- Bookmark
- Subscribe
- Mute
- Subscribe to RSS Feed
- Permalink
- Report Inappropriate Content
Correct, you can't create a .qvw file from it. Sorry, I assumed QlikView. But something is better than nothing. Let me take a look. I'll reply soon...
- Mark as New
- Bookmark
- Subscribe
- Mute
- Subscribe to RSS Feed
- Permalink
- Report Inappropriate Content
Table associations look okay.
I reread your original entry. Am I correct in understanding that you're trying to get the overall average condition score so that you just see that one number by itself, not as part of, say a pivot table or chart showing breakdowns? If so, I think what is happening is, by trying to compute an overall average, you're using condition score straight from the Conditions table without it associating back to the Trees data. Try doing a pivot table and use any Trees field as a dimension (COMMON might be a good one to use), and average the Condition Score then. Be sure to include a total line for the dimension to see the overall average condition score. This isn't an ideal solution, but it'll prove the theory. I'll play with Qlik Sense to come up with a more ideal solution so that you see just the one overall average condition score value.
- Mark as New
- Bookmark
- Subscribe
- Mute
- Subscribe to RSS Feed
- Permalink
- Report Inappropriate Content
I think I figured it out. It does seem, when doing avg([Condition score]), it is always averaging within the table the field is found - Conditions. To average the condition score of your Trees inventory, you'd have to do one of two things:
1. Load the data such that the condition score is part of the Trees table. Then use avg([Condition score]) and it should work. Yes, you'd be denormalizing and wouldn't need to load the Conditions table as a dimension table.
OR
2. Keep the setup you have now and change your expression to this:
avg(aggr(sum([Condition score]), [TreeID]))
By using the aggr() function, you'd first force QlikSense to sum the condition scores across the Trees data. In order for it to work correctly, the 2nd argument for aggr() has to be a field in Trees that is unique to each row. It seems TreeID will serve that purpose.
After aggr() gets the total condition score for all trees, then it will be averaged.
- Mark as New
- Bookmark
- Subscribe
- Mute
- Subscribe to RSS Feed
- Permalink
- Report Inappropriate Content
Craig,
That's is! That equation was just the right solution. Thanks so much. I'm giving a presentation on this tree inventory this week, and I used that as an excuse to do some exploring in Qlik for the first time. I'm in over my head (it took me a long time to realize that the average wasn't the right calculation because it "felt" right), but enjoying what I'm learning very much. And what a great community.
Thanks again for the help--my next lesson will be to tackle this aggr business.
~Kelaine