Unlock a world of possibilities! Login now and discover the exclusive benefits awaiting you.
- Qlik Community
- :
- Forums
- :
- Analytics
- :
- New to Qlik Analytics
- :
- Re: QlikSense Custom Coloured Bar Chart
- Subscribe to RSS Feed
- Mark Topic as New
- Mark Topic as Read
- Float this Topic for Current User
- Bookmark
- Subscribe
- Mute
- Printer Friendly Page
- Mark as New
- Bookmark
- Subscribe
- Mute
- Subscribe to RSS Feed
- Permalink
- Report Inappropriate Content
QlikSense Custom Coloured Bar Chart
Hi All,
I have a line chart in QlikSense.
its has
one dimension MonthYear, and
two expression
sum({<Product={'PRODUCT1'}>}Amount) and
sum({<Product={'PRODUCT2'}>}Amount)
I would like to assign two different custom colour for each of them and used color by expression with the following formula: IF(match(Product,'PRODUCT1'),colour_2,colour_2).
it hasnt worked.
any suggestion?
Thanks,
Daniel
Accepted Solutions
- Mark as New
- Bookmark
- Subscribe
- Mute
- Subscribe to RSS Feed
- Permalink
- Report Inappropriate Content
- Mark as New
- Bookmark
- Subscribe
- Mute
- Subscribe to RSS Feed
- Permalink
- Report Inappropriate Content
- Mark as New
- Bookmark
- Subscribe
- Mute
- Subscribe to RSS Feed
- Permalink
- Report Inappropriate Content
hi this wont solve my problem since what i would like to achive is not coloring by DIMENSION VALUE but would like to assigne a color for one expression and another color for the other expression.
Daniel
- Mark as New
- Bookmark
- Subscribe
- Mute
- Subscribe to RSS Feed
- Permalink
- Report Inappropriate Content
- Mark as New
- Bookmark
- Subscribe
- Mute
- Subscribe to RSS Feed
- Permalink
- Report Inappropriate Content
Hi Daniel,
If you are using Qlik Sense 3.2 or later you can just add the expressions as measure to your library and then you can assign one color per measure. These colors are then used in the visualizations.
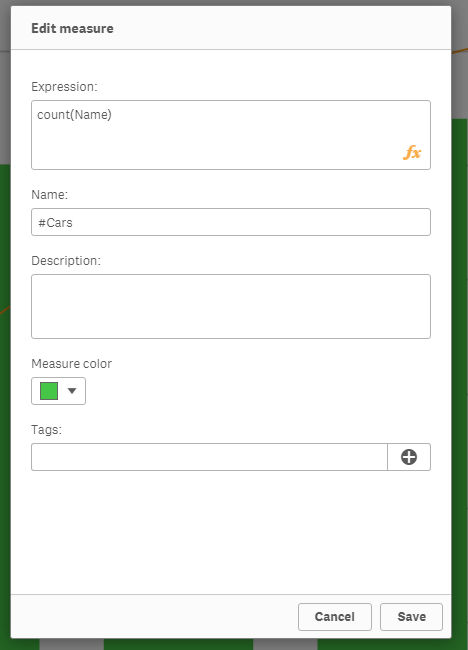
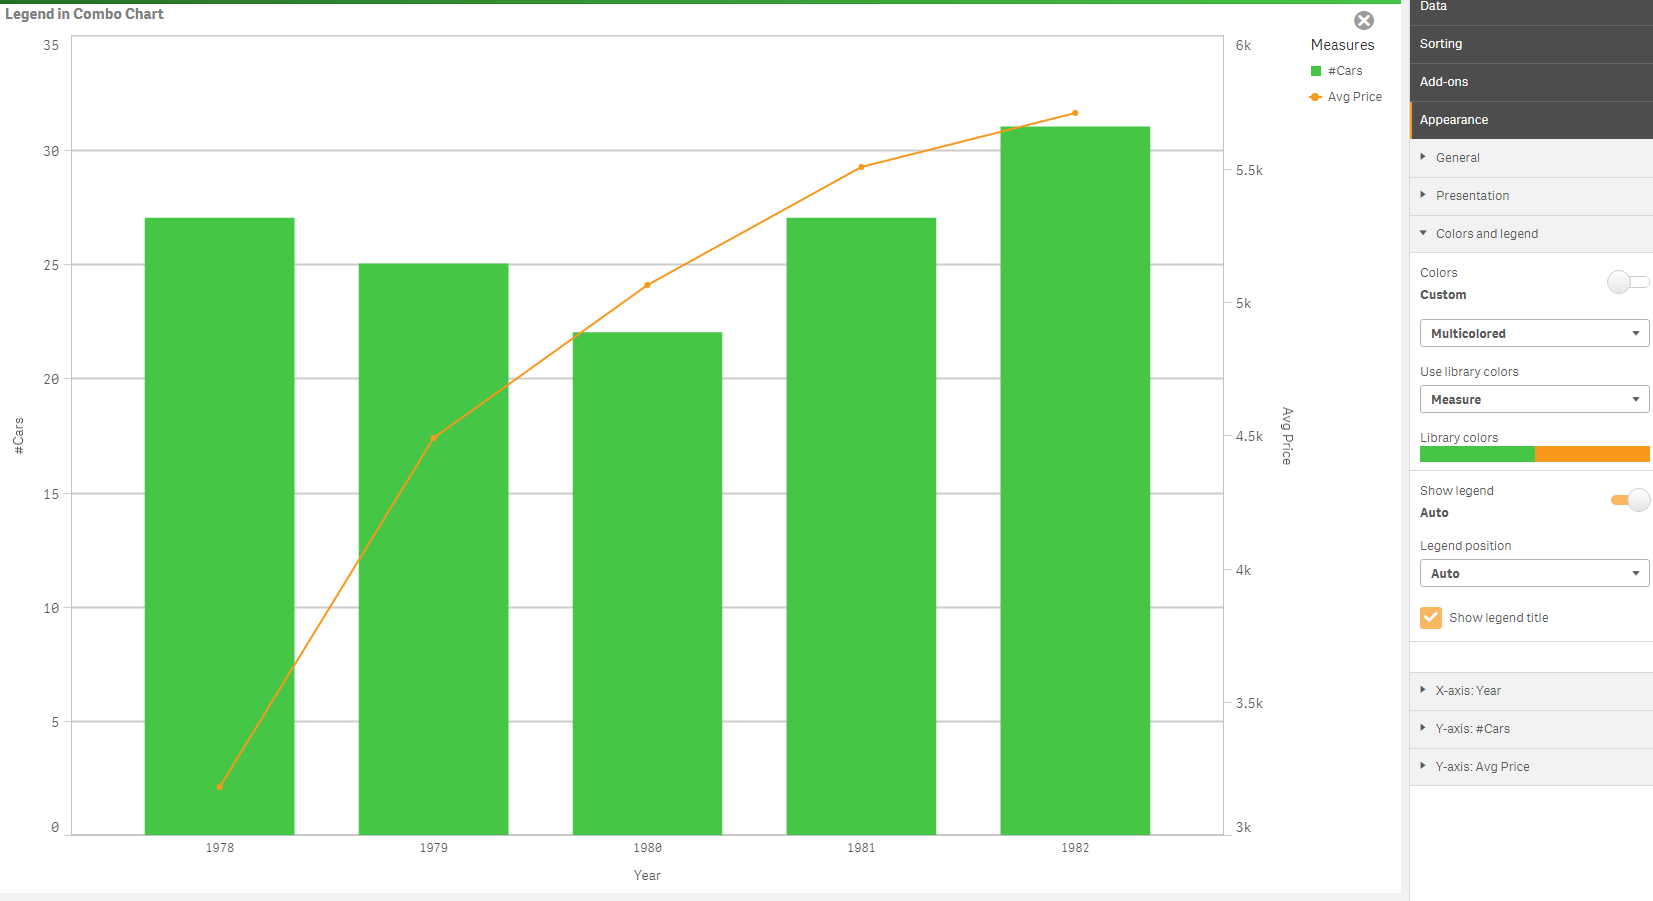
Best regards,
Patrik.
- Mark as New
- Bookmark
- Subscribe
- Mute
- Subscribe to RSS Feed
- Permalink
- Report Inappropriate Content
unfortunately using 3.1 I know 3.2 and Jun release but i have to solve the issue in 3.1.
going to try Bruno suggestion which could work as I checked it.
- Mark as New
- Bookmark
- Subscribe
- Mute
- Subscribe to RSS Feed
- Permalink
- Report Inappropriate Content
This is working, tried out, thanks Bruno.