Unlock a world of possibilities! Login now and discover the exclusive benefits awaiting you.
- Qlik Community
- :
- Forums
- :
- Analytics
- :
- New to Qlik Analytics
- :
- Re: Display Results based on Last Month
- Subscribe to RSS Feed
- Mark Topic as New
- Mark Topic as Read
- Float this Topic for Current User
- Bookmark
- Subscribe
- Mute
- Printer Friendly Page
- Mark as New
- Bookmark
- Subscribe
- Mute
- Subscribe to RSS Feed
- Permalink
- Report Inappropriate Content
Display Results based on Last Month
Hi all,
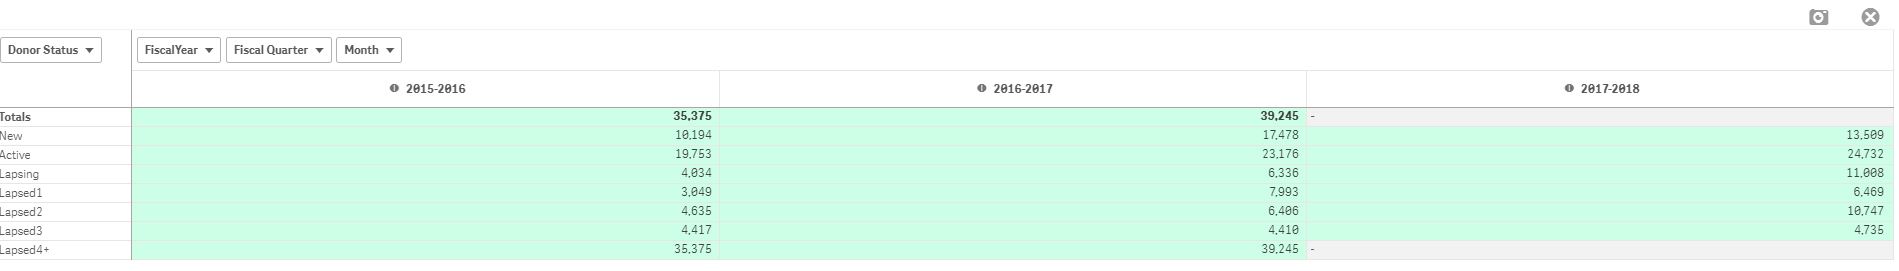
I have a pivot table that has Current donor status as a Row Dimension and Fiscal year, Fiscal Quarter and Fiscal Month as Column Dimension. The measure is number of donors, simple expression : count(distinct Donors). Please see screenshot below.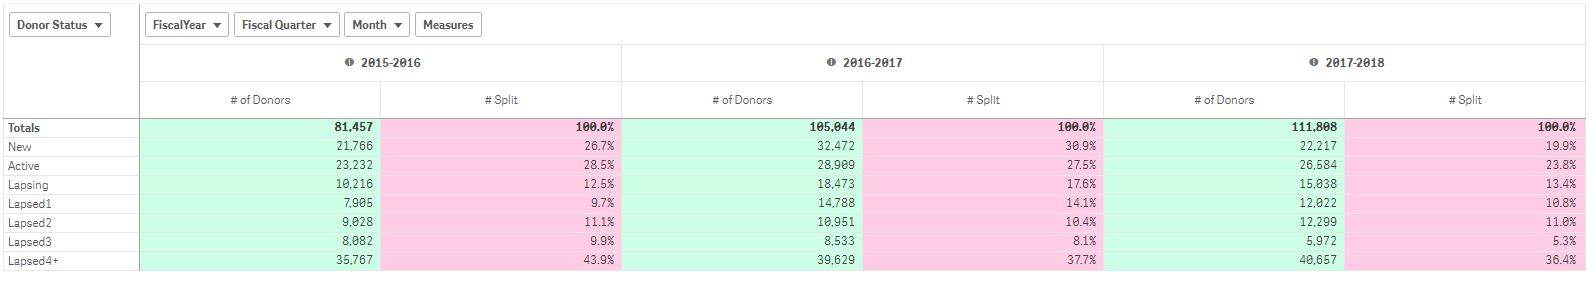
What I am trying to do is for each Fiscal Year instead of showing full year results to show only Last Month result for that Fiscal year and the same for Fiscal Quarter.
What i did so far is created variable vMaxFiscalMonth = Max(FiscalMonth) and added it to expression:
count({<FiscalMonth = {"=$(vMaxFiscalMonth)"}>} distinct Donors).
But the result is still for full year instead of Last Month.If I hard code it, means put 12 instead of variable it works but I cannot hard code it as I need it to be adjusted according to Fiscal year and Fiscal Quarter.
Can anyone let me what I am missing in my expression or any other solution?
Thanks
Denis
- Mark as New
- Bookmark
- Subscribe
- Mute
- Subscribe to RSS Feed
- Permalink
- Report Inappropriate Content
maybe this:
if( Max(FiscalMonth) = Max( TOTAL <FiscalYear> FiscalMonth), count(distinct Donors) )
- Mark as New
- Bookmark
- Subscribe
- Mute
- Subscribe to RSS Feed
- Permalink
- Report Inappropriate Content
Hi Sunny,
Unfortunately it does not give me the correct results.
Please see below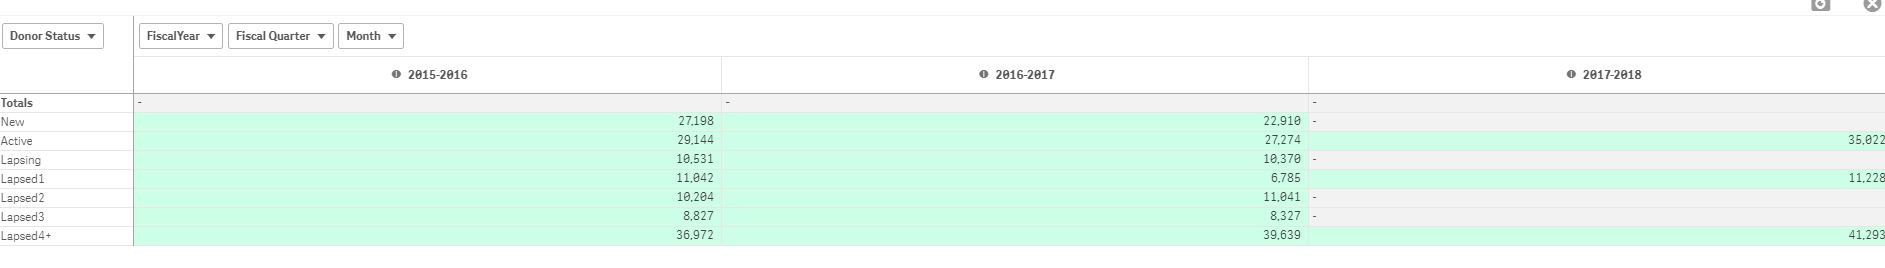
- Mark as New
- Bookmark
- Subscribe
- Mute
- Subscribe to RSS Feed
- Permalink
- Report Inappropriate Content
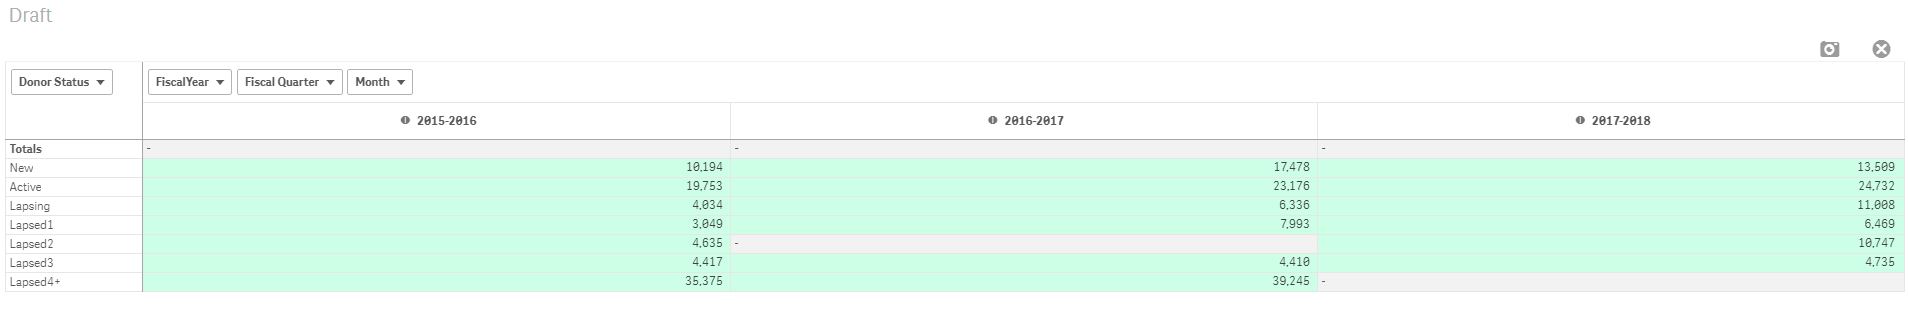
How about this
FirstSortedValue(Aggr(Count(DISTINCT Donors), [Donor Status], [Fiscal Year], [Fiscal Quarter], [Fiscal Month]), -Aggr([Fiscal Month], [Donor Status], [Fiscal Year], [Fiscal Quarter], [Fiscal Month]))
- Mark as New
- Bookmark
- Subscribe
- Mute
- Subscribe to RSS Feed
- Permalink
- Report Inappropriate Content
Hi Sunny,
It look like it works 
My only concern why sometimes it does not display data (look on screenshot)?
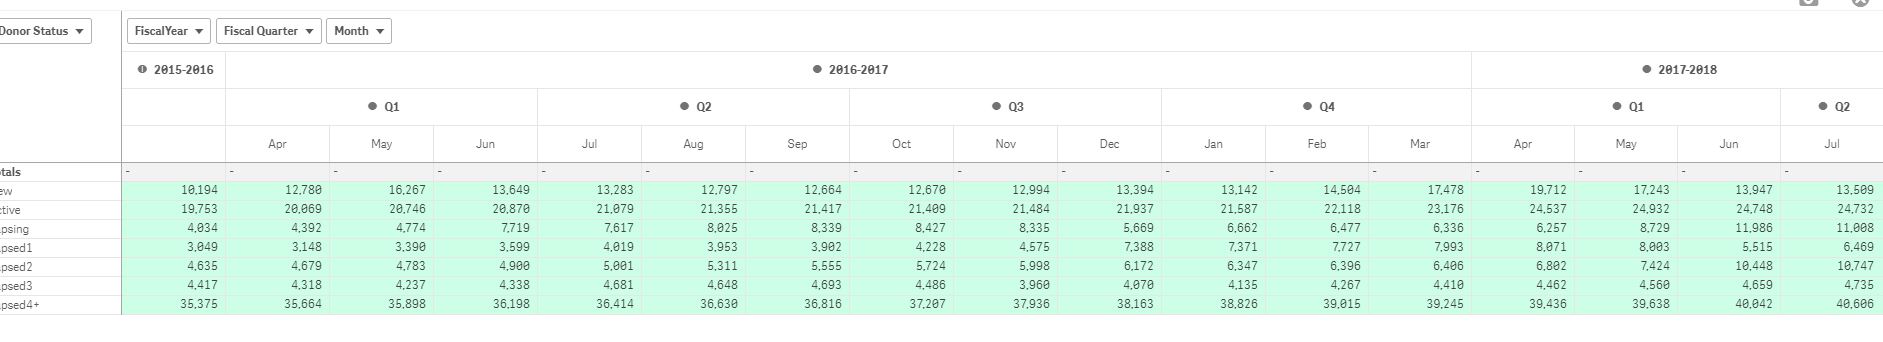
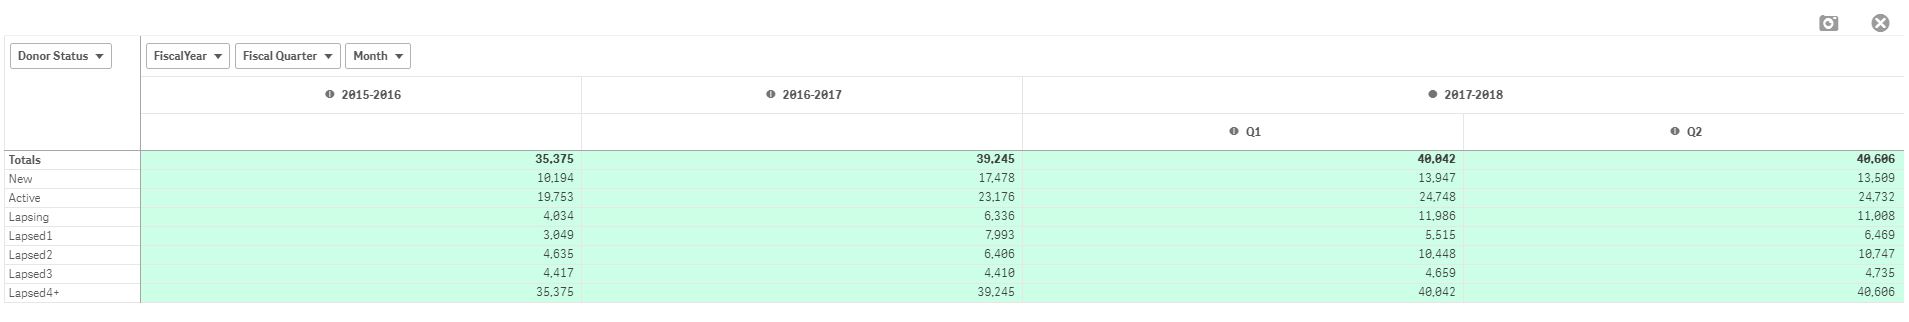
How ever if I expand the Fiscal Quarter and Fiscal Month id displays everything.
Without expanding:
After Expanding:
- Mark as New
- Bookmark
- Subscribe
- Mute
- Subscribe to RSS Feed
- Permalink
- Report Inappropriate Content
May be try using a DISTINCT....
FirstSortedValue(DISTINCT Aggr(Count(DISTINCT Donors), [Donor Status], [Fiscal Year], [Fiscal Quarter], [Fiscal Month]), -Aggr([Fiscal Month], [Donor Status], [Fiscal Year], [Fiscal Quarter], [Fiscal Month]))
- Mark as New
- Bookmark
- Subscribe
- Mute
- Subscribe to RSS Feed
- Permalink
- Report Inappropriate Content
Still does not work for 2017-2018, but worked for 2016-2017 though.
Also the totals are incorrect.
- Mark as New
- Bookmark
- Subscribe
- Mute
- Subscribe to RSS Feed
- Permalink
- Report Inappropriate Content
May be you have Fiscal Month in 2017-2018 with no Donor information?
- Mark as New
- Bookmark
- Subscribe
- Mute
- Subscribe to RSS Feed
- Permalink
- Report Inappropriate Content
You can try this
FirstSortedValue({<Donor = {'*'}>} DISTINCT Aggr(Count(DISTINCT Donors), [Donor Status], [Fiscal Year], [Fiscal Quarter], [Fiscal Month]), -Aggr(Only({<Donor = {'*'}>}[Fiscal Month]), [Donor Status], [Fiscal Year], [Fiscal Quarter], [Fiscal Month]))
- Mark as New
- Bookmark
- Subscribe
- Mute
- Subscribe to RSS Feed
- Permalink
- Report Inappropriate Content
no i have for every month,
If I expand the year it works.
- Mark as New
- Bookmark
- Subscribe
- Mute
- Subscribe to RSS Feed
- Permalink
- Report Inappropriate Content
What do you get when you use Max([Fiscal Month]) in this chart?