Unlock a world of possibilities! Login now and discover the exclusive benefits awaiting you.
- Qlik Community
- :
- All Forums
- :
- QlikView Administration
- :
- Re: Major Problem with Qlikview QVDistributionServ...
- Subscribe to RSS Feed
- Mark Topic as New
- Mark Topic as Read
- Float this Topic for Current User
- Bookmark
- Subscribe
- Mute
- Printer Friendly Page
- Mark as New
- Bookmark
- Subscribe
- Mute
- Subscribe to RSS Feed
- Permalink
- Report Inappropriate Content
Major Problem with Qlikview QVDistributionService.exe
I am new to Qlikview and don't know much about memory leaks, but that is what I appear to have going on.
Our Management Console has been running the same jobs for over a year now with no problems. In the last few days, it takes jobs that run in one hour over three hours to run. Every jobs run-time is magnified (increased) by at least three to four times.
The only thing I really knew to do was look at the Windows Task Manager to see what all was running in Processes. I appears as though the QVDistributionService.exe just continues to increase the memory even when NOTHING is running. I think this runs until it maxes out and then my Qlikview jobs won't run anymore.
Does anyone know why console jobs would take 4X longer to run than before?
Thanks,
Joel
PS: I am very green at this.
- Tags:
- qlikview_deployment
- Mark as New
- Bookmark
- Subscribe
- Mute
- Subscribe to RSS Feed
- Permalink
- Report Inappropriate Content
I did check these things, Marcus. I went ahead and loaded one of the huge files that one of these slow running jobs puts out and verified that there are no cartesian results and every row is unique. At first I thought this was a result of something on the back end database we run these qlikview jobs against having tables or fields change, along with some joins, but that is not the case.
Thanks,
Joel
- Mark as New
- Bookmark
- Subscribe
- Mute
- Subscribe to RSS Feed
- Permalink
- Report Inappropriate Content
Apparently, the slowdown is happening entirely during the execution of the Load script. You may be right in assuming that QlikView isn't directly responsible for this slowdown, especially because all your documents run slower and "nothing changed" in code or configuration.
A reload is usually not very cpu-dependent, but reloads are negatively affected by RAM shortages. So I think you should let your admin guy check these two situations:
- Is the machine that runs the QlikView Distribution Service running just QlikView? Or has another I/O intensive application been added, causing collisions when accessing disks?
- Ask for a RAM usage graph for a full reload period (like the one documented in the TaskLog above), and check whether the QDS has RAM left at all times (total RAM usage well below 90%). It could be that the QVS service runs off with a large chunk of the server's memory, but I'm not sure I understand how the services are distributed.
Oh and BTW: you can attach files and stuff to a post by launching the "Advanced Editor" (bottom right) and selecting the Attach link (bottom left).
Peter
- Mark as New
- Bookmark
- Subscribe
- Mute
- Subscribe to RSS Feed
- Permalink
- Report Inappropriate Content
Sorry, the Advanced Editor link is in the top right corner of the post editing window.
- Mark as New
- Bookmark
- Subscribe
- Mute
- Subscribe to RSS Feed
- Permalink
- Report Inappropriate Content
AS next I would go with the suggestion from Peter and to look for the RAM consumption. Is there is nothing noticable I would check the storage/network and then possible security-measure - maybe there is anywhere a change.
- Marcus
- Mark as New
- Bookmark
- Subscribe
- Mute
- Subscribe to RSS Feed
- Permalink
- Report Inappropriate Content
Pete and Others,
Any more ideas?
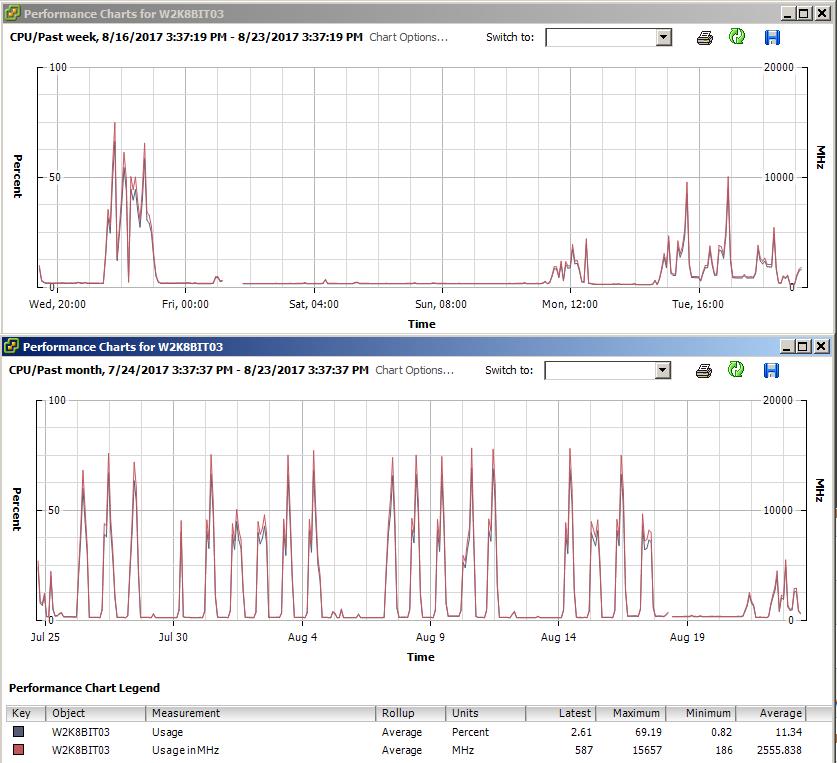
These graphs were snapshotted and sent to me by IT yesterday at 3:40 PM CST.
- The top graph is the CPU for the past week.
- Bottom graph is for the past month. The spikes clearly show the jobstream being run, which takes on the order of 10 or so hours per day when running at normal speeds
I didn't notice this problem until just Monday. Notice on last Thursday, the activity seemed close to what is shown as regular usage with the bottom graph, which shows usage up into 75% of CPU. It didn't run on Friday. But once Monday/Tuesday of this week hit, we get much lower CPU utilizations. It's like something happened over the weekend but our IT guy denies it is their problem.
Thanks,
Joel
- Mark as New
- Bookmark
- Subscribe
- Mute
- Subscribe to RSS Feed
- Permalink
- Report Inappropriate Content
Take a look at the DocumentLog.txt file generated by the reload (after enabling per Colin's note) to see what phase of the reload is taking the time.
-Rob
- Mark as New
- Bookmark
- Subscribe
- Mute
- Subscribe to RSS Feed
- Permalink
- Report Inappropriate Content
Any more ideas? No, just the same: get a memory performance chart. If only to be able to safely exclude any memory allocation problems.
- Mark as New
- Bookmark
- Subscribe
- Mute
- Subscribe to RSS Feed
- Permalink
- Report Inappropriate Content
Rob,
I opened the qlikview job in qlikview and checked the Generate Logfile checkbox. The job finished running and I checked the C:\ProgramData\QlikTech\DistributionService\1\Log\20170825\075036 - Step1_BIT_Build\ folder, which is where I would expect to find it. All I found was a "TaskLog", similar to the one I copy/pasted above. There is no DocumentLog text file. Is this placed in another folder somewhere?
Thanks,
Joel
- Mark as New
- Bookmark
- Subscribe
- Mute
- Subscribe to RSS Feed
- Permalink
- Report Inappropriate Content
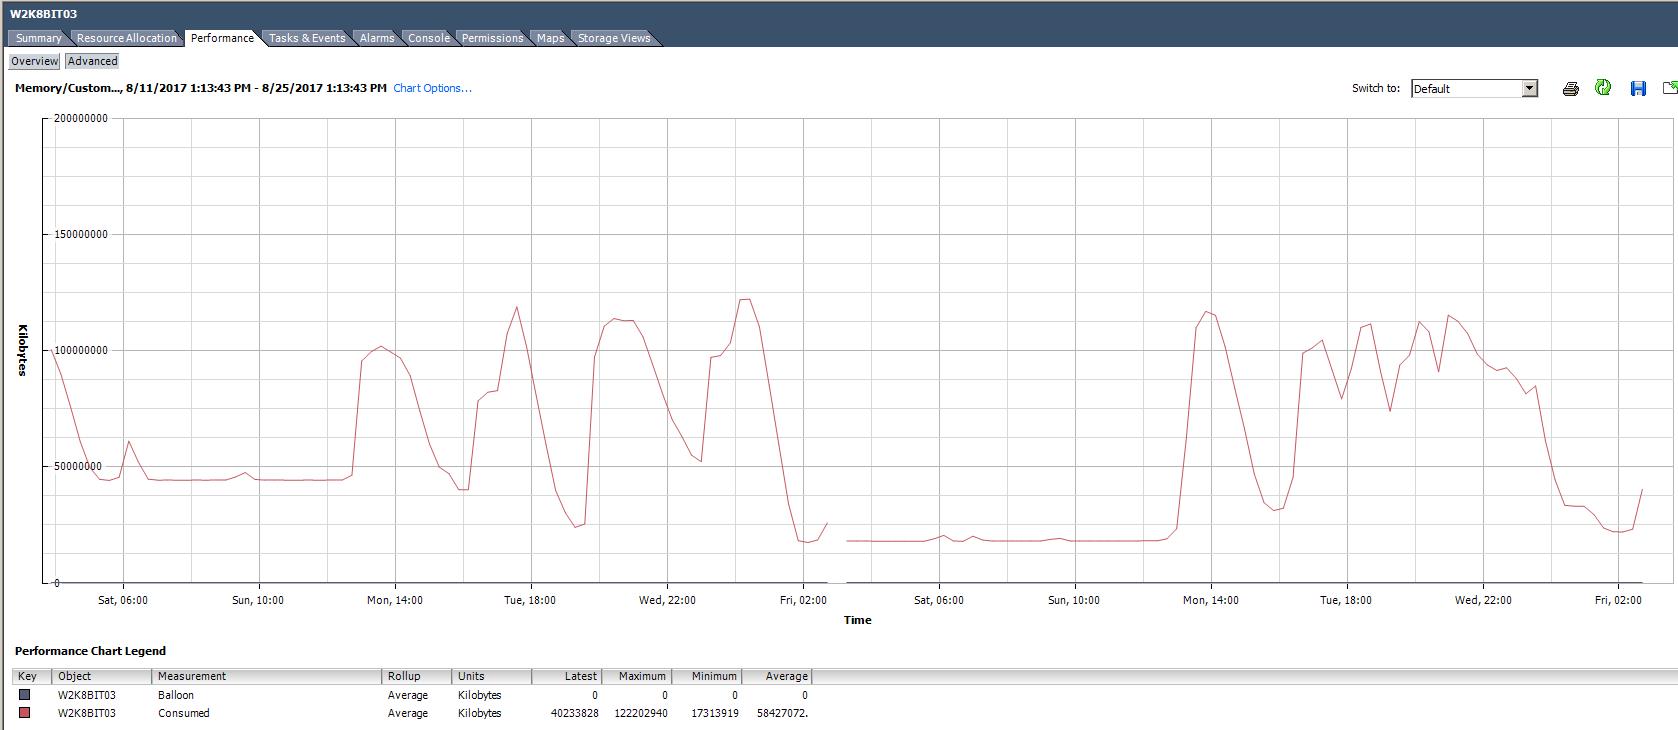
Peter,
Here is the memory performance chart. This is for the last two weeks. The problem started either Friday the 18th or Monday the 21st.
Thanks,
Joel
- Mark as New
- Bookmark
- Subscribe
- Mute
- Subscribe to RSS Feed
- Permalink
- Report Inappropriate Content
That's the correct folder.
If a document log is being generated, it should also be in the same folder as the QVW, with the same name as the qvw plus '.log' extension. In your case, there should be a "Step_1_VCHG_PFT_PHY.qvw.log" in the source folder. Iis it there?
-Rob