Unlock a world of possibilities! Login now and discover the exclusive benefits awaiting you.
- Qlik Community
- :
- Forums
- :
- Analytics
- :
- New to Qlik Analytics
- :
- Re: Problem with set analysis
- Subscribe to RSS Feed
- Mark Topic as New
- Mark Topic as Read
- Float this Topic for Current User
- Bookmark
- Subscribe
- Mute
- Printer Friendly Page
- Mark as New
- Bookmark
- Subscribe
- Mute
- Subscribe to RSS Feed
- Permalink
- Report Inappropriate Content
Problem with set analysis
Hi all,
For days now I am struggling to get my expression working and need your help. I'd like to calculate the percentage of orders that have higher than the requested quantity. This should be done only for orders with the same unit of measure and displayed in pivot table per department. Below a simplified script:
Data:
Load*Inline
[
Order|Item|Requested|Requested_Unit|Ordered|Ordered_Unit|Department
O100|I10|2|T|3|T|Materials
O100|I20|2000|KG|3|T|Materials
O200|I10|30|KG|70|KG|Materials
O200|I20|50|KG|50|KG|Packaging
]
(Delimiter is '|');

Table:
Load
    If(Requested_Unit=Ordered_Unit, 'Same_unit', 'Different_unit') as Unit,
    Order,
    Item,
    Requested,
    Requested_Unit,
    Ordered,
    Ordered_Unit,
    Department
Resident Data;
Drop Table Data;
For order O100, only the first line should be taken into account, as the second line has different units (KG and T).
For order O200 both lines should be considered since the unit of measure is the same (KG).
Therefore, the result should be:
Department Materials: 100% (2 orders with Ordered > Requested out of 2 orders in total)
Department Packaging: 0% (0 orders with Ordered > Requested out of 1 orders)
Please note that all data needs to be loaded and nothing can be excluded in the script. I tried with this expression in pivot table...
Count({<Unit={'Same_unit'}, Order={"=Sum(Ordered) > Sum(Requested)"}>}Distinct Order)
/
Count({<Unit={'Same_unit'}>}Distinct Order)
...but it gives totally wrong results. It does not consider O100 at all (probably because one of the entries has different measures) and counts O200 as Ordered > Requested for both departments (not sure why, maybe it takes the sum of quantity for the entire order and not per department).
I really hope that somebody can help me out here. Cheers!
- « Previous Replies
-
- 1
- 2
- Next Replies »
- Mark as New
- Bookmark
- Subscribe
- Mute
- Subscribe to RSS Feed
- Permalink
- Report Inappropriate Content
Thank you for the effort!
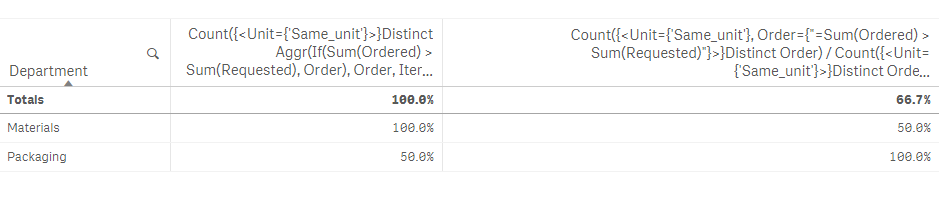
I checked this with my real data and it does not quite work. I slightly updated the load script (posted above) to better reflects the real situation. The result should be Materials: 100%, Packaging: 50% and your formula returns 150% and 0% respectively.
- Mark as New
- Bookmark
- Subscribe
- Mute
- Subscribe to RSS Feed
- Permalink
- Report Inappropriate Content
How about this?
Count({<Unit={'Same_unit'}>}Distinct Aggr(If(Sum(Ordered) > Sum(Requested), Order), Order, Item, Department))/Count({<Unit={'Same_unit'}>}Distinct Order)
- Mark as New
- Bookmark
- Subscribe
- Mute
- Subscribe to RSS Feed
- Permalink
- Report Inappropriate Content
Hi Steve
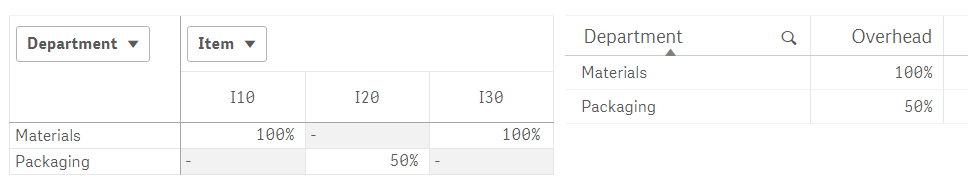
Please take a look at the sample qvf:
I used the latest sample data you've given.
- Mark as New
- Bookmark
- Subscribe
- Mute
- Subscribe to RSS Feed
- Permalink
- Report Inappropriate Content
This is great, exactly the same result as RecNo() in the script. Thank you very much Sunny, I appreciate your help and time!!!
- Mark as New
- Bookmark
- Subscribe
- Mute
- Subscribe to RSS Feed
- Permalink
- Report Inappropriate Content
I must also mention that the solution provided by Stefan works great as well, but unfortunately I cannot use it because of restrictions coming from our IT.
- Mark as New
- Bookmark
- Subscribe
- Mute
- Subscribe to RSS Feed
- Permalink
- Report Inappropriate Content
Thank you for the effort. It appears that your expression does not count distinct orders, i.e. adding a line like this:
O300|I20|2000|KG|3000|KG|Packaging
would count O300 twice instead of only once.
Anyways, the solution provided by Sunny above works. Thanks again for your reply.
- « Previous Replies
-
- 1
- 2
- Next Replies »