Unlock a world of possibilities! Login now and discover the exclusive benefits awaiting you.
- Qlik Community
- :
- All Forums
- :
- QlikView App Dev
- :
- Re: Stock & Box Plot
- Subscribe to RSS Feed
- Mark Topic as New
- Mark Topic as Read
- Float this Topic for Current User
- Bookmark
- Subscribe
- Mute
- Printer Friendly Page
- Mark as New
- Bookmark
- Subscribe
- Mute
- Subscribe to RSS Feed
- Permalink
- Report Inappropriate Content
Stock & Box Plot
Dear all
Kindly advise how to use Stock & Box Plot in Display Options under Expression to show Opening, Closing and Average Share Prices ?
Thank you
Tracy
Accepted Solutions
- Mark as New
- Bookmark
- Subscribe
- Mute
- Subscribe to RSS Feed
- Permalink
- Report Inappropriate Content
Dear Rob
Thanks so much for your kind sharing, you are so knowledgeable.
Can the line be thicker (too thin) like the one in Box Plot?.
Thank You
Tracy
- Mark as New
- Bookmark
- Subscribe
- Mute
- Subscribe to RSS Feed
- Permalink
- Report Inappropriate Content
See the Help under Stock in the Help for combo chart. You must uncheck "bar" and "line" Display Options on the first expression and then Stock will be available as an option. You will enter up to 4 sub expressions as detailed in the help. Combo Chart ‒ QlikView
-Rob
- Mark as New
- Bookmark
- Subscribe
- Mute
- Subscribe to RSS Feed
- Permalink
- Report Inappropriate Content
Dear Rob
I have tried but it is not working, can you show me an example ?.
Thank You
Tracy
- Mark as New
- Bookmark
- Subscribe
- Mute
- Subscribe to RSS Feed
- Permalink
- Report Inappropriate Content
Hi Tracy,
For a Stock Plot, you'll need at least a High and Low price fields. Close price is optional. If you provide some sample data with those three fields, I'll provide you a example.
You've also asked about using a box plot. A box plot would not have any meaning for the sample data you provided. A box plot shows distributions of values over a Dimension. You have only one -- or two if count each field -- value for each Dimension.
More on box plots here
- Mark as New
- Bookmark
- Subscribe
- Mute
- Subscribe to RSS Feed
- Permalink
- Report Inappropriate Content
Dear Rob
Many thank for your help, please find the sample file attached.
Hope to see all four variables Open, Close, High & Low in one chart.
Thank you
Tracy
- Mark as New
- Bookmark
- Subscribe
- Mute
- Subscribe to RSS Feed
- Permalink
- Report Inappropriate Content
Here you go, attached.
-Rob
- Mark as New
- Bookmark
- Subscribe
- Mute
- Subscribe to RSS Feed
- Permalink
- Report Inappropriate Content
Dear Rob
Thanks so much for your kind sharing, you are so knowledgeable.
Can the line be thicker (too thin) like the one in Box Plot?.
Thank You
Tracy
- Mark as New
- Bookmark
- Subscribe
- Mute
- Subscribe to RSS Feed
- Permalink
- Report Inappropriate Content
You can mark Rob answer as correct as he resolve the issue?
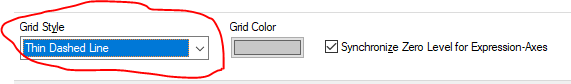
For your question, May be look this from Axes Tab which solve the issue. May be helps
- Mark as New
- Bookmark
- Subscribe
- Mute
- Subscribe to RSS Feed
- Permalink
- Report Inappropriate Content
Dear Anil
Thank you for your help.
Only "Stock High" is displayed as Expression Legend, please advise how to display the rest known as Low, Open and Close in the Legends?.
Best Regards
Tracy