Unlock a world of possibilities! Login now and discover the exclusive benefits awaiting you.
- Qlik Community
- :
- All Forums
- :
- QlikView App Dev
- :
- Re: Highlight Certain Fields
- Subscribe to RSS Feed
- Mark Topic as New
- Mark Topic as Read
- Float this Topic for Current User
- Bookmark
- Subscribe
- Mute
- Printer Friendly Page
- Mark as New
- Bookmark
- Subscribe
- Mute
- Subscribe to RSS Feed
- Permalink
- Report Inappropriate Content
Highlight Certain Fields
Hi,
I am having an issue highlighting certain fields in my pivot table.
I have a dataset like this.
% of cars
1
2
3
4
5
6
7
8
9
I am using the following IF statement to arrange them into groups within the pivot.
=if ([% of Cars] <5, '<5%',
if ([% of Cars] <=7 , '6-7%',
if ([% of Cars] <=8 , '7-8%',
if ([% of Cars] <=9, '8-9%',
if ([% of Cars] <=10, '9-10%',
if ([% of Cars] >10, '>10%',
))))))
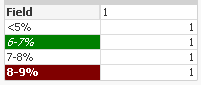
The script works fine in sorting them into their designated fields. However I would like certain fields such as the <=10 and >10 to be in Red. I would like <5 and <=7 to be green. Does anyone know how to achieve this? I have tried for quite a while and I can not seem to find a solution.
- Mark as New
- Bookmark
- Subscribe
- Mute
- Subscribe to RSS Feed
- Permalink
- Report Inappropriate Content
May be this?
- Mark as New
- Bookmark
- Subscribe
- Mute
- Subscribe to RSS Feed
- Permalink
- Report Inappropriate Content
Hi,
You can set this in the background colour of the dimension
- Mark as New
- Bookmark
- Subscribe
- Mute
- Subscribe to RSS Feed
- Permalink
- Report Inappropriate Content
This doesn't work for me.
Say you had
=if ([% of Cars] <5, '<5%',
if ([% of Cars] <=7 , '6-7%',
if ([% of Cars] <=8 , '7-8%',
if ([% of Cars] <=9, '8-9%',
if ([% of Cars] <=10, '9-10%',
if ([% of Cars] >10, '>10%',
))))))
how would i colour each cell. so for >10 red ,<= 9 blue etc. your trick doesn't work as i am using the script shown above.
- Mark as New
- Bookmark
- Subscribe
- Mute
- Subscribe to RSS Feed
- Permalink
- Report Inappropriate Content
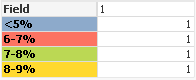
Like this?
- Mark as New
- Bookmark
- Subscribe
- Mute
- Subscribe to RSS Feed
- Permalink
- Report Inappropriate Content
What is the as Field Inline?
This is my current script in the dimensions.
=if ([% of cars] <5, '<5%',
if ([% of cars] <=7 , '6-7%',
if ([% of cars] <=8 , '7-8%',
if ([% of cars] <=9, '8-9%',
if ([% of cars] <=10, '9-10%',
if ([% of cars] >10, '>10%',
))))))
From here how would i assign certain colors?
- Mark as New
- Bookmark
- Subscribe
- Mute
- Subscribe to RSS Feed
- Permalink
- Report Inappropriate Content
Have you opened my script?
LOAD *, if ([% of cars] <5, '<5%',if ([% of cars] <=7 , '6-7%',if ([% of cars] <=8 , '7-8%',if ([% of cars] <=9, '8-9%',if ([% of cars] <=10, '9-10%',
if ([% of cars] >10, '>10%')))))) as Field Inline [
% of cars
1
2
3
4
5
6
7
8
9
];
- Mark as New
- Bookmark
- Subscribe
- Mute
- Subscribe to RSS Feed
- Permalink
- Report Inappropriate Content
Yes i did - However , the data is being read in from a excel file with 100s of lines so i cannot add the "as Field Inline Script in the main script editor - I am adding the Script from the Chart properties -> Dimensions then adding my script
- Mark as New
- Bookmark
- Subscribe
- Mute
- Subscribe to RSS Feed
- Permalink
- Report Inappropriate Content
Please post sample application and design colors for cells?