Unlock a world of possibilities! Login now and discover the exclusive benefits awaiting you.
- Qlik Community
- :
- All Forums
- :
- QlikView App Dev
- :
- Set a custom dimension to show more than 12 month
- Subscribe to RSS Feed
- Mark Topic as New
- Mark Topic as Read
- Float this Topic for Current User
- Bookmark
- Subscribe
- Mute
- Printer Friendly Page
- Mark as New
- Bookmark
- Subscribe
- Mute
- Subscribe to RSS Feed
- Permalink
- Report Inappropriate Content
Set a custom dimension to show more than 12 month
Hi!
I'm kinda new to qlikview but I love it. I've searched the forum and google the hell out of me but I cannot seem to find the answer.
I have loaded a xlsx file with colums:
Month Year NSV CM ....
1 2009
2 2009
3 2010
4 2011
ETC.
What I need to do is to in one diagram show how the CM (contribution margin) varies over time (month). To show this in a sensible way I'd like the dimensions to show all the years month in a row e.g.
X-axel: 1,2,3,4,5,6,7,8,9,10,11,12,1,2,3,4,5,6,7,8,9,10,11,12 etc
The first 1-12 is for 2009, the second is for 2010 etc.
I've tried to set the expressions to specific years but it lacks pedagogical overview. Can someone please help. I'm doing an internship with way to much responsibility and to little time 
My experience in coding and java-like language are very limited, thus an educational explantion would be much appriciated.
Best regards
Robin Rendahl
- Mark as New
- Bookmark
- Subscribe
- Mute
- Subscribe to RSS Feed
- Permalink
- Report Inappropriate Content
Add a field to your calendar table using this expression
Date(MonthEnd(Date(DateField)),'M')
Date fields are special and contain a numeric value and the numeric equivalent so if you advance your detail date to the Month End Date then you will only get one value per month but since you will be using the dual properties of the date data type you will have the numbers 1-12 displayed but the actual values will be equivalent to the appropriate month ending dates.
Good Luck
Chris
- Mark as New
- Bookmark
- Subscribe
- Mute
- Subscribe to RSS Feed
- Permalink
- Report Inappropriate Content
Chis,
I really appriciate your help but thats like greek to me. Where is my calendar table?
When I tries to set dimension to
Date(MonthEnd(Date(month)),'M')
The graph only showes month 1 and 12.
- Mark as New
- Bookmark
- Subscribe
- Mute
- Subscribe to RSS Feed
- Permalink
- Report Inappropriate Content
Oh, so you want to use the formula as a chart dimension.
And I did not pay attention to your sample data, sorry about that.
The easiest thing to do would be to add a date field to your spreadsheet, let's call it NSV_Date (my best guess based on your columns)
then you would have in your load script
Load
Field1,
Field2,
Field3,
Date(MonthEnd(Date(DateField)),'M') as [Distinct Month]
From ...
Or you should be able to do this with the data you have, however this is more tricky and requires a calcualted dimension which I would not reccommend.
Date(MonthEnd(Date(Num([Month] & '/1/' & [Year]))),'M')
Hope this helps
- Mark as New
- Bookmark
- Subscribe
- Mute
- Subscribe to RSS Feed
- Permalink
- Report Inappropriate Content
Hi,
As per my understanding of your query you just need to set your charts multi dimensions in proper order. PFA.
The charts use Year & Month as dimensions, and the CM field as expression. Probably the second chart would be better, as it uses Month as primary dimension and year as secondary. This would also be better in UI perspective as the bars wont be crowded because the months will remain fixed i.e 12 months Jan-Dec, while the number of years would depend on your data. Incase, using Year as primary dimension, do set your Dimension limitations under Presentation tab of chart properties. Yeah, but do setup your calendar stuff first, incase you creating master calendar.
Is this what you were looking for? Or have I completely misunderstood, do let me know.
Thanks.
- Mark as New
- Bookmark
- Subscribe
- Mute
- Subscribe to RSS Feed
- Permalink
- Report Inappropriate Content
Thank you guys!
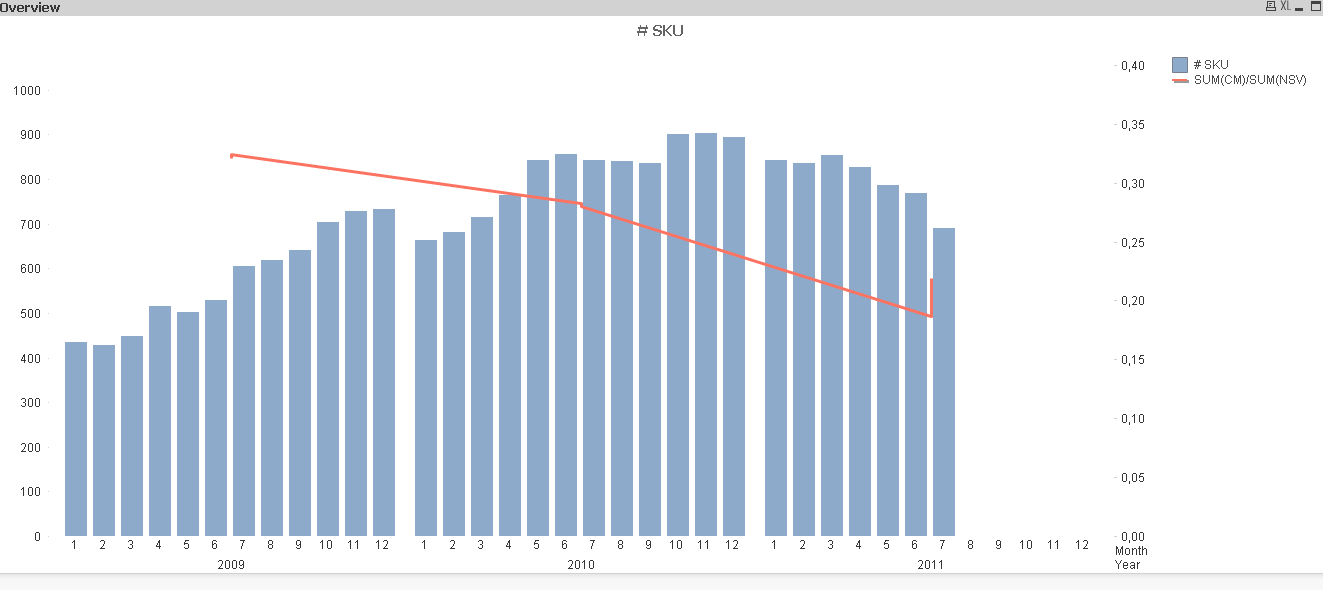
Lawrence, it was as easy as you suggested. But when I set Year as primary dimension - my # SKUs is displayed correctly (per month) but Contribution margins is only shown per year and not per month. Please see attached photo.
- Mark as New
- Bookmark
- Subscribe
- Mute
- Subscribe to RSS Feed
- Permalink
- Report Inappropriate Content
Hi,
Probably, you are doing a Sum(), so its summing up data for all months in the year and then displaying values per year only. May be you can try drilling down further by creating a Weekday dimension or so, you may try that out.
Secondly, incase you are showcasing data varying over time, its better to use line charts. Play around with your charts dimensions and you will get to the answer.
Thanks.