Unlock a world of possibilities! Login now and discover the exclusive benefits awaiting you.
- Qlik Community
- :
- All Forums
- :
- QlikView App Dev
- :
- Re: Issue with stacking accumulation in bar chart
- Subscribe to RSS Feed
- Mark Topic as New
- Mark Topic as Read
- Float this Topic for Current User
- Bookmark
- Subscribe
- Mute
- Printer Friendly Page
- Mark as New
- Bookmark
- Subscribe
- Mute
- Subscribe to RSS Feed
- Permalink
- Report Inappropriate Content
Issue with stacking accumulation in bar chart
Hi Friends,
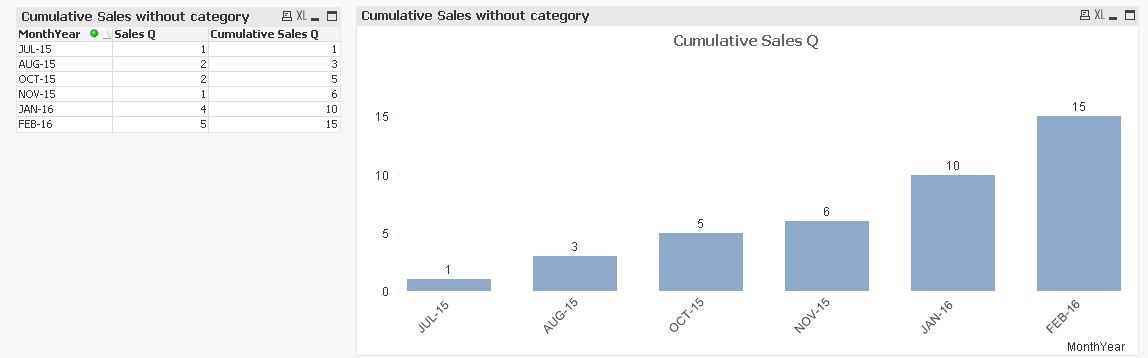
I am trying to build a stacked bar chart where the expression is a cumulative sum of sales. The x axis is time in months and the stack dimension is category. So I want the stack dimension to accumulate over time and show up in the following months (even if a month in consideration did not have any value for a particular category).
Now this accumulation works correctly if I am not adding category dimension as displayed below.
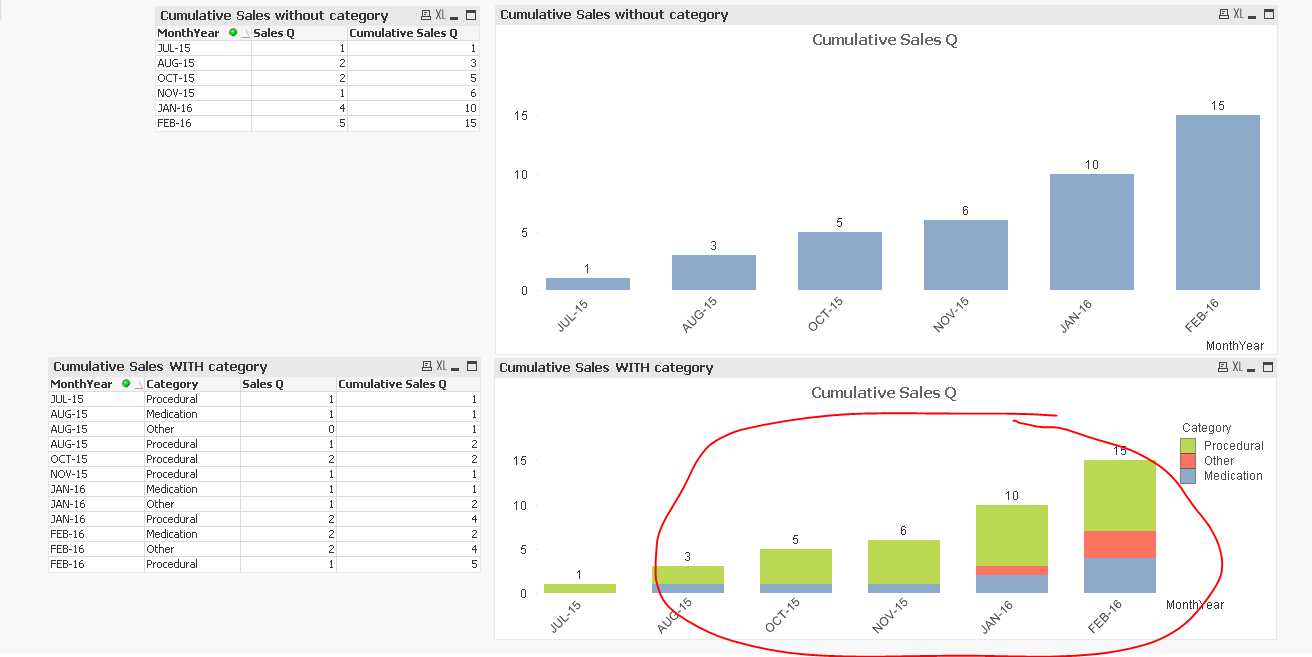
But the moment I add category as a second dimension (to stack), the chart skews up. If a particular month doesn't have value for a particular category, that category is excluded from the bar for that month. See the below diagram when Category dimension is added to the same chart. The month FEB-16 should show a cumulative total of 15 for me with the categories rolled up till then. But,
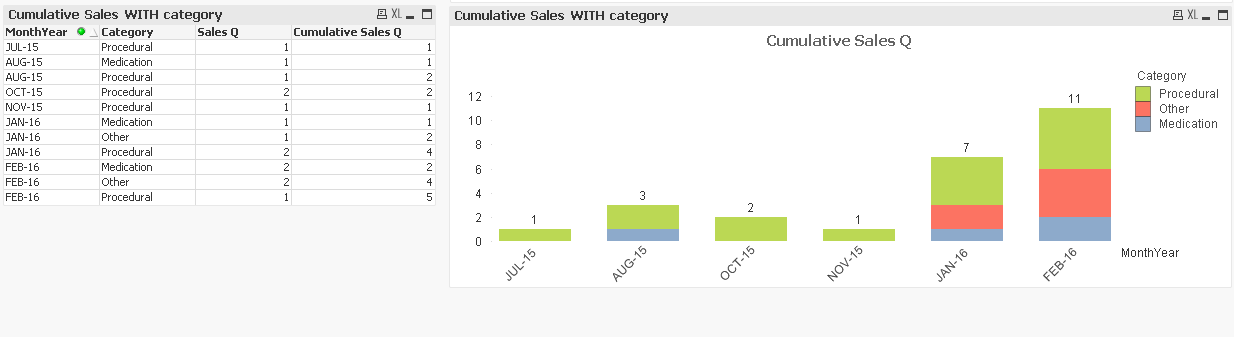
The expression I am using is RangeSum(Above(Sum([Sales Qnty]),0,RowNo()))
I have also tried Just Sum([Sales Qnty] with "Full Accumulation" option checked - but that isn't helping either.
Is there any way I can handle this tweaking the expression or so ?
I am attaching the sample qvw and data source. Please help !!
- « Previous Replies
-
- 1
- 2
- Next Replies »
- Mark as New
- Bookmark
- Subscribe
- Mute
- Subscribe to RSS Feed
- Permalink
- Report Inappropriate Content
Thanks Kamiel,
I can see that this works in the example. But when I apply this in my actual scenario, it is not working for unknown reasons. I ended up adding five separate expressions (each for each category) in the chart to make it stack.
Regards,
Vishnu
- Mark as New
- Bookmark
- Subscribe
- Mute
- Subscribe to RSS Feed
- Permalink
- Report Inappropriate Content
Hi All,
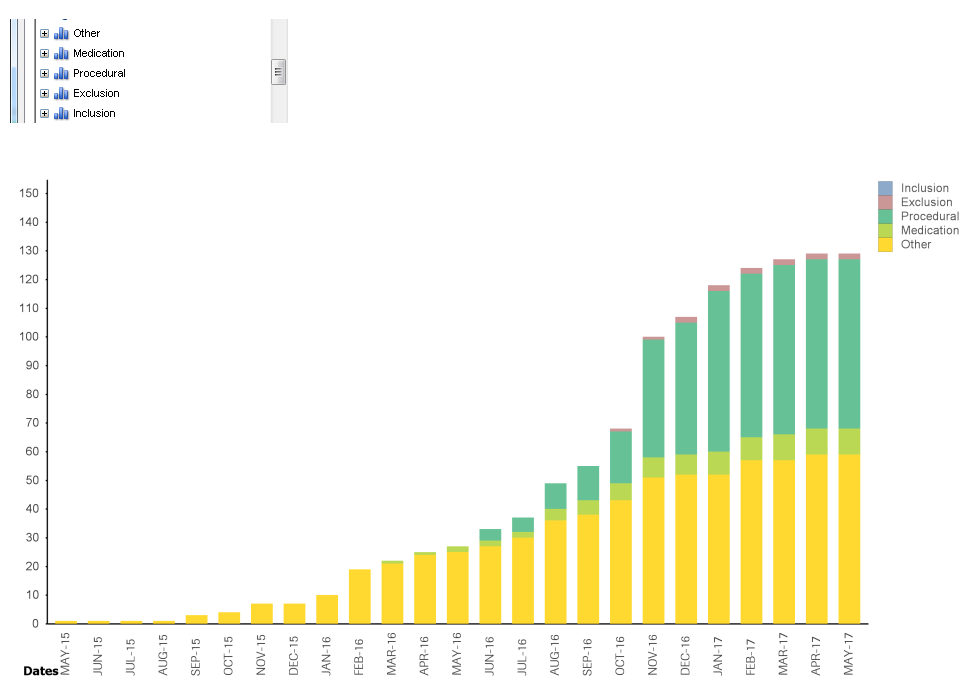
Thanks a lot for the different options you all provided. In my actual scenario I found that the best solution was to
- remove category dimension
- month-year will be the only dimension
- setting the chart styling to 'stacked'
- added 5 expressions (one each for each category)
- expression example RangeSum(Above(Sum{<Category={'Inclusion'}>}([Sales Qnty]),0,RowNo()))
Regards,
Vishnu
- Mark as New
- Bookmark
- Subscribe
- Mute
- Subscribe to RSS Feed
- Permalink
- Report Inappropriate Content
Not sure, but can this work?
Script
Table:
LOAD MonthYear&Category as Temp,
TimeSort,
MonthYear,
Category,
[Sales Qnty]
FROM
[Cumulative Stack Example.xls]
(biff, embedded labels, table is Sheet1$);
TempTable:
LOAD MonthYear
Resident Table;
Join (TempTable)
LOAD Category
Resident Table;
Concatenate(Table)
LOAD MonthYear,
Category
Resident TempTable
Where Not Exists(Temp, MonthYear&Category);
DROP Table TempTable;
Expression
Aggr(RangeSum(Above(Sum([Sales Qnty]),0,RowNo())), Category, MonthYear)
or this if you don't have MonthYear sorted correctly in script and you have QV12 or above
Aggr(RangeSum(Above(Sum([Sales Qnty]),0,RowNo())), Category, (MonthYear, (numreic)))
- Mark as New
- Bookmark
- Subscribe
- Mute
- Subscribe to RSS Feed
- Permalink
- Report Inappropriate Content
Hi Vishnu,
I'm glad to know that you found the solution you were looking for. If you won't mind and if possible can you please post what exactly worked for you (expressions, settings, etc.) with sample data/app for the help of community.
Thanks,
Vijay
- « Previous Replies
-
- 1
- 2
- Next Replies »