Unlock a world of possibilities! Login now and discover the exclusive benefits awaiting you.
- Qlik Community
- :
- All Forums
- :
- QlikView App Dev
- :
- Re: Graph Help with Months
- Subscribe to RSS Feed
- Mark Topic as New
- Mark Topic as Read
- Float this Topic for Current User
- Bookmark
- Subscribe
- Mute
- Printer Friendly Page
- Mark as New
- Bookmark
- Subscribe
- Mute
- Subscribe to RSS Feed
- Permalink
- Report Inappropriate Content
Graph Help with Months
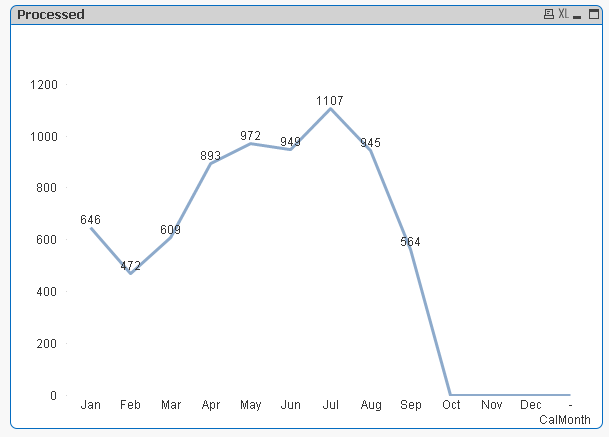
I am trying to achieve a graph that shows all the months, regardless of the data. I am showing the sum of processed per month in the graph. Right now it only shows up until September (Current month), but I also want to have Oct, Nov, Dec in there as well although they will just be zeros. This is the app I currently am working with. If there are any alternate solutions, I am open. Thanks! ! !
- Mark as New
- Bookmark
- Subscribe
- Mute
- Subscribe to RSS Feed
- Permalink
- Report Inappropriate Content
Hi Joshua,
I think it is QlikSense feature that it will not show those months. If we do the same chart in QlikView then you will see remaining months.
As can be seen in screen shot below.
- Mark as New
- Bookmark
- Subscribe
- Mute
- Subscribe to RSS Feed
- Permalink
- Report Inappropriate Content
Can you send me the qlikview app?
- Mark as New
- Bookmark
- Subscribe
- Mute
- Subscribe to RSS Feed
- Permalink
- Report Inappropriate Content
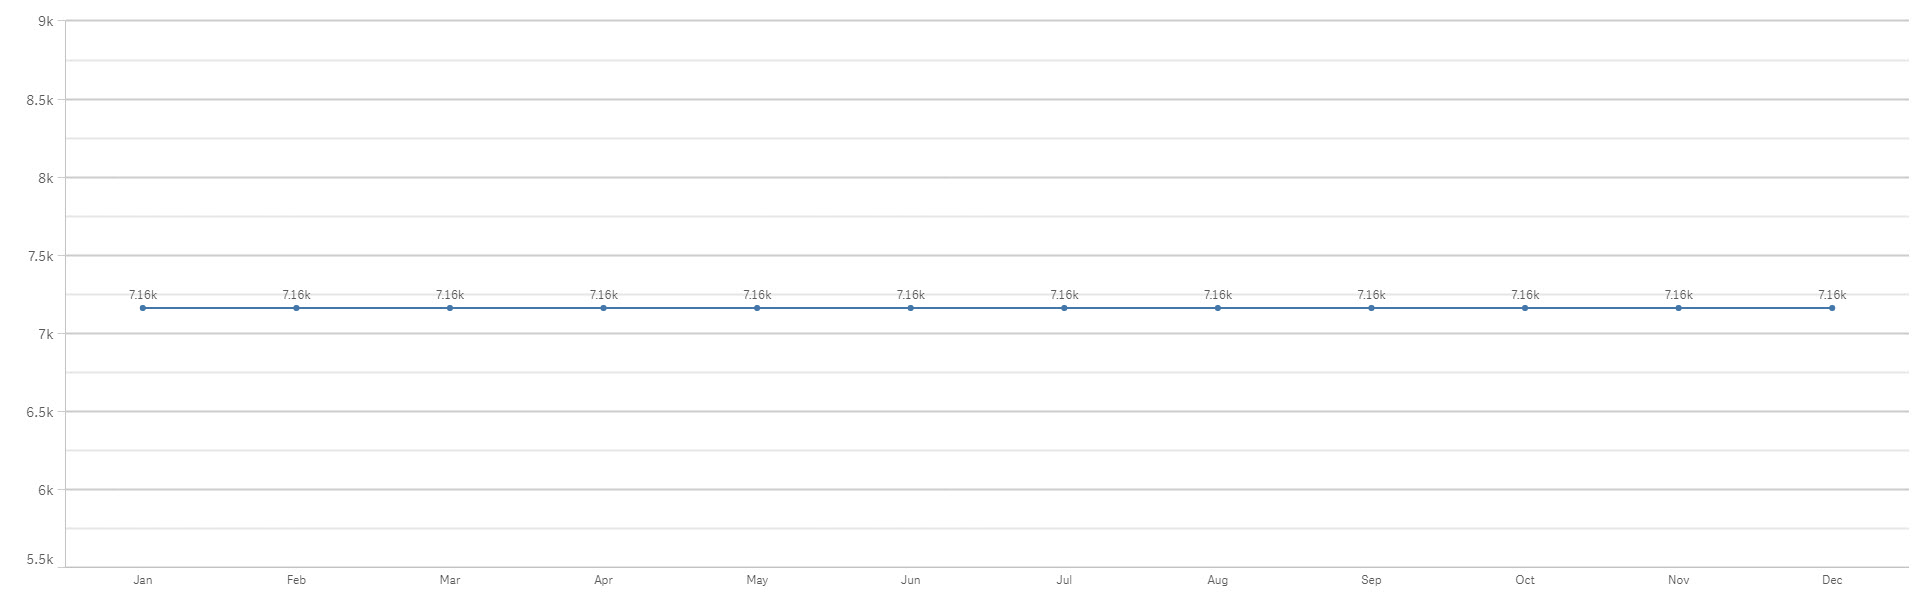 Ok, So I changed the dimension to CalMonth and shows all months.
This is my expression, and it only shows the total for everything each month rather than the total for each month.
Sum({$<Program_Dash={'Mechanical Inspection'}, Status_Dash={'Completed'}, Year = {"$(=Year(FirstWorkDate(ConvertToLocalTime(Date(now()), 'GMT-05:00'),1,$(vHolidays))))"}>} Processed_Dash)
- Mark as New
- Bookmark
- Subscribe
- Mute
- Subscribe to RSS Feed
- Permalink
- Report Inappropriate Content
here it is
- Mark as New
- Bookmark
- Subscribe
- Mute
- Subscribe to RSS Feed
- Permalink
- Report Inappropriate Content
Yeah, I put your script in and just shows till Sept. Can you take a look at the one i sent?
- Mark as New
- Bookmark
- Subscribe
- Mute
- Subscribe to RSS Feed
- Permalink
- Report Inappropriate Content
Hey Vishwarath,
Can you take a look at my app?
- Mark as New
- Bookmark
- Subscribe
- Mute
- Subscribe to RSS Feed
- Permalink
- Report Inappropriate Content
Hi Joshua,
I'm looking at your file "graph help (1).qvf". Will update.
BR,
Vijay
- Mark as New
- Bookmark
- Subscribe
- Mute
- Subscribe to RSS Feed
- Permalink
- Report Inappropriate Content
Sure just give me few minutes.
- Mark as New
- Bookmark
- Subscribe
- Mute
- Subscribe to RSS Feed
- Permalink
- Report Inappropriate Content
Hi Joshua,
is there any reason you are not linking your calendar to fact table?
- Mark as New
- Bookmark
- Subscribe
- Mute
- Subscribe to RSS Feed
- Permalink
- Report Inappropriate Content
What do you mean?