Unlock a world of possibilities! Login now and discover the exclusive benefits awaiting you.
- Qlik Community
- :
- All Forums
- :
- QlikView App Dev
- :
- Re: Graph Help with Months
- Subscribe to RSS Feed
- Mark Topic as New
- Mark Topic as Read
- Float this Topic for Current User
- Bookmark
- Subscribe
- Mute
- Printer Friendly Page
- Mark as New
- Bookmark
- Subscribe
- Mute
- Subscribe to RSS Feed
- Permalink
- Report Inappropriate Content
Graph Help with Months
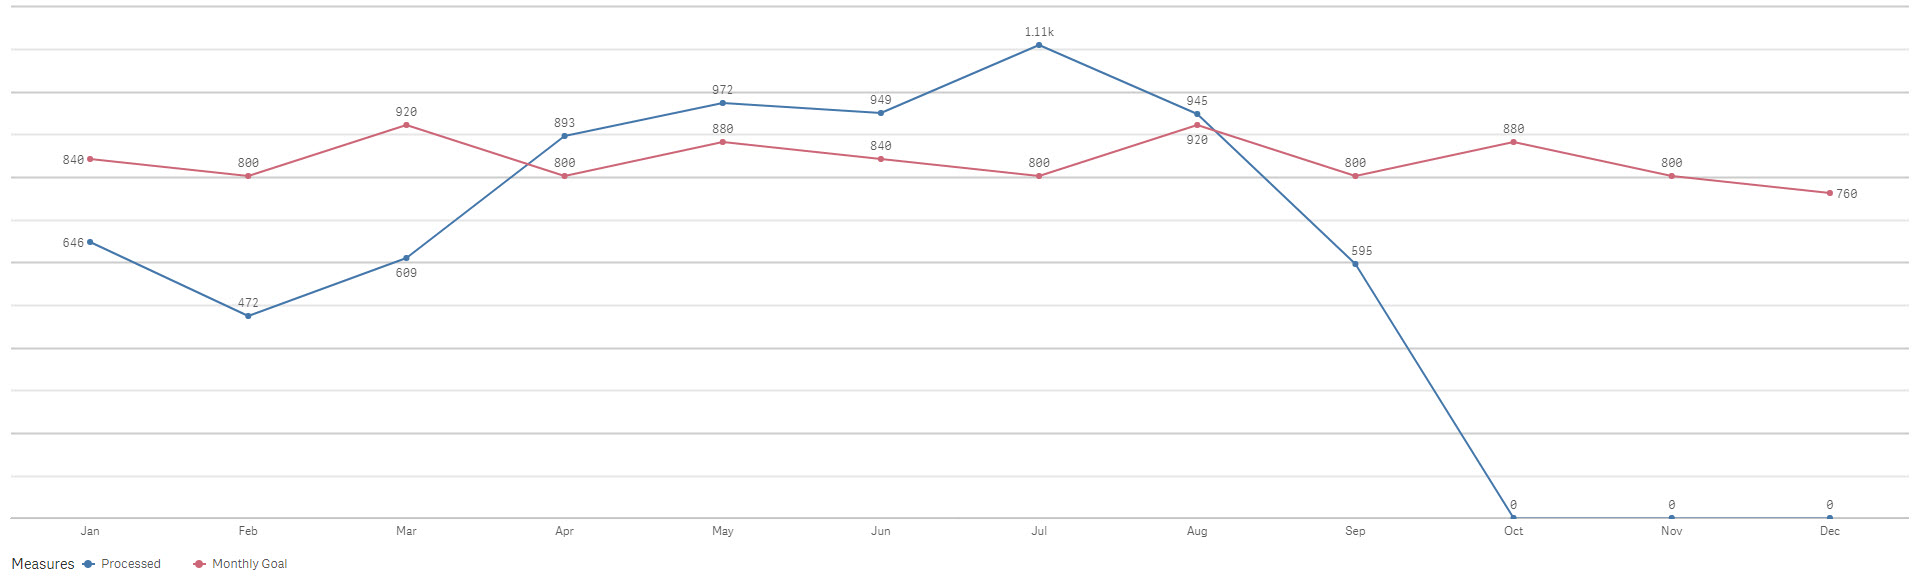
I am trying to achieve a graph that shows all the months, regardless of the data. I am showing the sum of processed per month in the graph. Right now it only shows up until September (Current month), but I also want to have Oct, Nov, Dec in there as well although they will just be zeros. This is the app I currently am working with. If there are any alternate solutions, I am open. Thanks! ! !
- Mark as New
- Bookmark
- Subscribe
- Mute
- Subscribe to RSS Feed
- Permalink
- Report Inappropriate Content
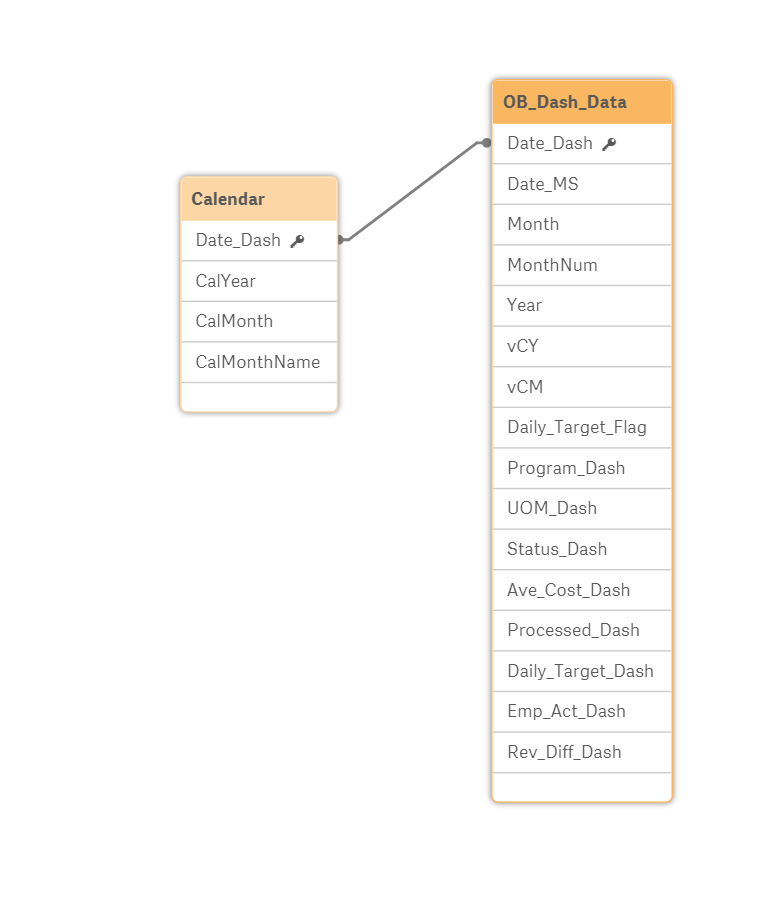
In your file Data Model is as seen in screen shot below. It does not have connections between tables. that is not typical. Sunny Talwar also pointed that in his reply earlier.
 DM.PNG)
Normally a typical data model would like following or just one fact table by itself
- Mark as New
- Bookmark
- Subscribe
- Mute
- Subscribe to RSS Feed
- Permalink
- Report Inappropriate Content
like this?
- Mark as New
- Bookmark
- Subscribe
- Mute
- Subscribe to RSS Feed
- Permalink
- Report Inappropriate Content
sorry, this one...
- Mark as New
- Bookmark
- Subscribe
- Mute
- Subscribe to RSS Feed
- Permalink
- Report Inappropriate Content
Hello Joshua,
I can see the data until end of year but can we actually display 0 values for those last 3 months in Qliksense. I am not that versant in Qliksense, may be move this to Qliksense forum to see what answers we get.
- Mark as New
- Bookmark
- Subscribe
- Mute
- Subscribe to RSS Feed
- Permalink
- Report Inappropriate Content
Hi Joshua,
I'm still trying. It has been challenging in QlikSense. The change you have done in data model is one way to link tables. In your case calendar to fact table.
may be you want to post question in QlikSense forum as mentioned by Vishwarath Nagaraju. We are running out of options at the moment
BR,
Vijay
- Mark as New
- Bookmark
- Subscribe
- Mute
- Subscribe to RSS Feed
- Permalink
- Report Inappropriate Content
Not sure if you placed your new question MasterCalendar help in following
New to Qlik Sense
- Mark as New
- Bookmark
- Subscribe
- Mute
- Subscribe to RSS Feed
- Permalink
- Report Inappropriate Content
I believe I did.
But I have figured it out. If I use an IF statement, then they all come up. Not sure why, but they do. I am adding a secondary line to the line graph to get our goal requirement for the month and this is how I am doing it.
=if(WildMatch(MonthNum,'1'),400,
if(WildMatch(MonthNum,'2'),'550'))
- Mark as New
- Bookmark
- Subscribe
- Mute
- Subscribe to RSS Feed
- Permalink
- Report Inappropriate Content
Are these static values you are using or Sum(ProcessedDash) ?
- Mark as New
- Bookmark
- Subscribe
- Mute
- Subscribe to RSS Feed
- Permalink
- Report Inappropriate Content
Processed Line:
Sum({$<Program_Dash={'Mechanical Inspection'}, Status_Dash={'Completed'}, Year = {"$(=Year(FirstWorkDate(ConvertToLocalTime(Date(now()), 'GMT-05:00'),1,$(vHolidays))))"}>} Processed_Dash)
Goal Line:
=if(WildMatch(CalMonth,'Jan'),840,
if(WildMatch(CalMonth,'Feb'),800,
if(WildMatch(CalMonth,'Mar'),920,
if(WildMatch(CalMonth,'Apr'),800,
if(WildMatch(CalMonth,'May'),880,
if(WildMatch(CalMonth,'Jun'),840,
if(WildMatch(CalMonth,'Jul'),800,
if(WildMatch(CalMonth,'Aug'),920,
if(WildMatch(CalMonth,'Sep'),800,
if(WildMatch(CalMonth,'Oct'),880,
if(WildMatch(CalMonth,'Nov'),800,
if(WildMatch(CalMonth,'Dec'),760
))))))))))))
Dimension:
CalMonth
- Mark as New
- Bookmark
- Subscribe
- Mute
- Subscribe to RSS Feed
- Permalink
- Report Inappropriate Content
Second expression caused the zero's in first chart to show up.