Unlock a world of possibilities! Login now and discover the exclusive benefits awaiting you.
- Qlik Community
- :
- All Forums
- :
- QlikView App Dev
- :
- Re: Bar Chart For Monthly
Options
- Subscribe to RSS Feed
- Mark Topic as New
- Mark Topic as Read
- Float this Topic for Current User
- Bookmark
- Subscribe
- Mute
- Printer Friendly Page
Turn on suggestions
Auto-suggest helps you quickly narrow down your search results by suggesting possible matches as you type.
Showing results for
Not applicable
2017-09-21
11:16 PM
- Mark as New
- Bookmark
- Subscribe
- Mute
- Subscribe to RSS Feed
- Permalink
- Report Inappropriate Content
Bar Chart For Monthly
I want to created a bar chart based on month.
Data source for example:
| Resolved | Created |
|---|---|
| 17/08/2017 00:27 | 17/08/2017 00:14 |
| 16/08/2017 18:26 | 16/08/2017 18:18 |
| 16/09/2017 18:18 | 16/08/2017 19:07 |
| 16/09/2017 18:18 | 16/08/2017 17:30 |
I want it to be:
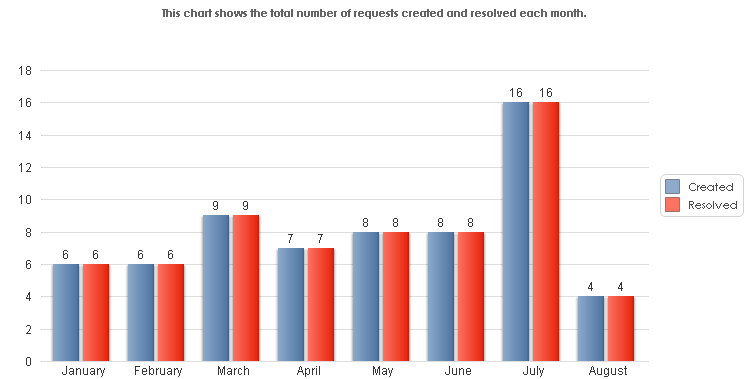
As you see for the August, the count Blue Bar should be 4 and Red Bar should be 2 based on the data source.
How do i achieve it based on the month count
442 Views
1 Reply
MVP
2017-09-22
11:19 AM
- Mark as New
- Bookmark
- Subscribe
- Mute
- Subscribe to RSS Feed
- Permalink
- Report Inappropriate Content
I believe you need to use IntervalMatch here and link your master calendar to the two dates in your fact table.
386 Views