Unlock a world of possibilities! Login now and discover the exclusive benefits awaiting you.
- Qlik Community
- :
- Forums
- :
- Analytics
- :
- New to Qlik Analytics
- :
- Re: Using alternative measures with colour by expr...
- Subscribe to RSS Feed
- Mark Topic as New
- Mark Topic as Read
- Float this Topic for Current User
- Bookmark
- Subscribe
- Mute
- Printer Friendly Page
- Mark as New
- Bookmark
- Subscribe
- Mute
- Subscribe to RSS Feed
- Permalink
- Report Inappropriate Content
Using alternative measures with colour by expression
Hi there,
I was wondering, if it is possible to use alternative measures in a chart with colour by expression.
Let's say i have the following data set:
Name Value1 Value2
A 1 2
B 2 3
A 1 2
I create a bar chart with "Name" as dimension and a measure with sum(Value1). On top of that i declare sum(Value2) as alternative for my first measure.
Now i want to colour the bars depending on their value. I want every bar with a value higher than 2 to be coloured green and the rest red.
With only one measure it's kind of easy to use the following code: "if(sum(Value1) > 2, green(),red())", but is there a possibility to use a more generic code to make sure, this colour expression code is applicable to every measure I define?
Thanks in advance!
Accepted Solutions
- Mark as New
- Bookmark
- Subscribe
- Mute
- Subscribe to RSS Feed
- Permalink
- Report Inappropriate Content
Do you have different conditions for different measures then it wont work
- Mark as New
- Bookmark
- Subscribe
- Mute
- Subscribe to RSS Feed
- Permalink
- Report Inappropriate Content
Hi,
Without using an alternative measure i have tried the coloring
dimension 1: name
dimension 2: ValueList('Value 1','Value 2')
measure:
if(ValueList('Value 1','Value 2') = 'Value 1',sum(Value1),
if(ValueList('Value 1','Value 2') = 'Value 2',sum(Value2)))
color by expression:
if(ValueList('Value 1','Value 2') = 'Value 1' AND sum(Value1)> 2, Green(),
if(ValueList('Value 1','Value 2') = 'Value 2' AND sum(Value2)> 2, Green(), RED()))
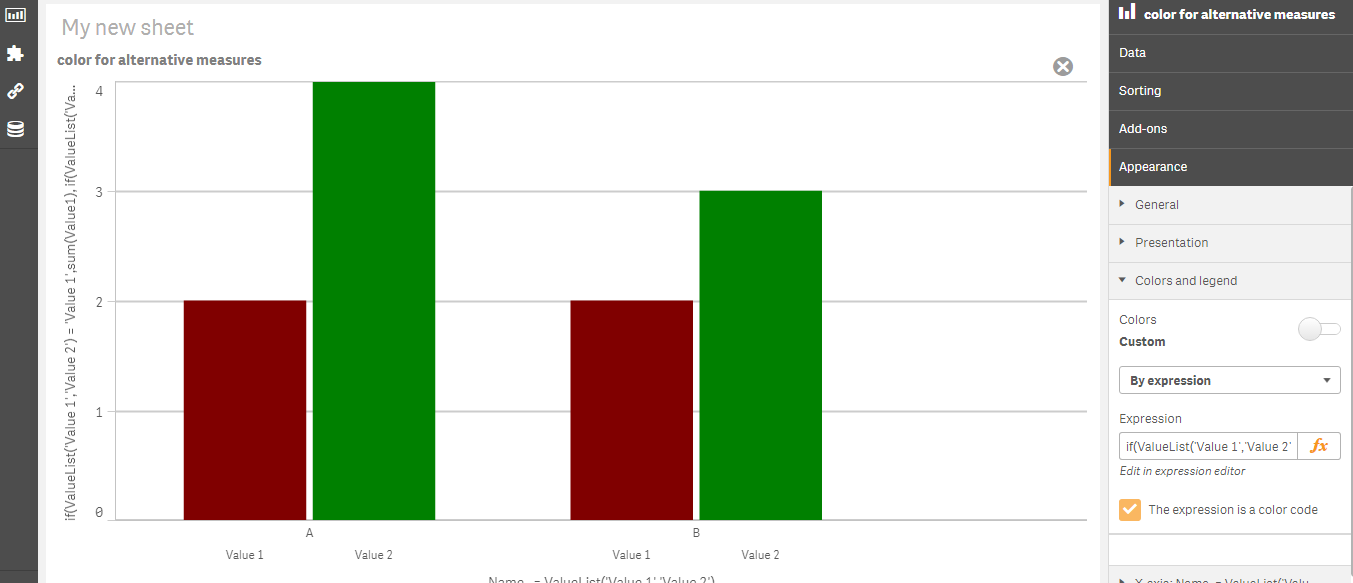
Will this help you?? You can explore the valuelist function too it will be helpful in such scenarios
- Mark as New
- Bookmark
- Subscribe
- Mute
- Subscribe to RSS Feed
- Permalink
- Report Inappropriate Content
Hi Janani,
unfortunately that's not exactly what I was looking for. I was aware of the valuelist function and how to use this to achieve what you mentioned.
I wanted to get a visualisation in which the user can chose which measure to see. In your case every measure would be shown at the same time.
I know a possible way would be to use variables, but i wondered, if it is also possible using alternative measures.
Greetings
- Mark as New
- Bookmark
- Subscribe
- Mute
- Subscribe to RSS Feed
- Permalink
- Report Inappropriate Content
try,
if(column(1) > 2, green(),red())
This should work for Alternative Measures
- Mark as New
- Bookmark
- Subscribe
- Mute
- Subscribe to RSS Feed
- Permalink
- Report Inappropriate Content
Hey Shraddha,
didn't know about this function, seems very helpful thanks!
But this won't save my problem, because I want to colour the bars depending on what measure I chose.
If i write something like this:
if(column(1) > 100, green(),
if(column(2) > 3, green(),red()))
if i chose the second measure this measure will be painted green() if my first measure is higher than 100.
- Mark as New
- Bookmark
- Subscribe
- Mute
- Subscribe to RSS Feed
- Permalink
- Report Inappropriate Content
Do you have different conditions for different measures then it wont work
- Mark as New
- Bookmark
- Subscribe
- Mute
- Subscribe to RSS Feed
- Permalink
- Report Inappropriate Content
Yes, that was so requirement to have different conditions depending on which measure is "active". But thanks for the hint with the column()-function!