Unlock a world of possibilities! Login now and discover the exclusive benefits awaiting you.
- Qlik Community
- :
- All Forums
- :
- QlikView Administration
- :
- Re: Strange behaviour of the Concat function in a ...
- Subscribe to RSS Feed
- Mark Topic as New
- Mark Topic as Read
- Float this Topic for Current User
- Bookmark
- Subscribe
- Mute
- Printer Friendly Page
- Mark as New
- Bookmark
- Subscribe
- Mute
- Subscribe to RSS Feed
- Permalink
- Report Inappropriate Content
Strange behaviour of the Concat function in a chart
Hi everybody,
I'm trying to use the CONCAT function to process data.
I've created and XLS file with this test data.
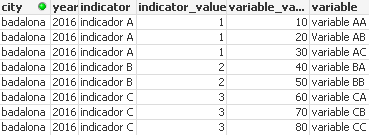
I've created a table graphic Chart like this.

I have 3 dimensions: city, year and Indicator.
So in the context of this dimensions, one Indicator, in a year in a city will have some variables.
In the case of city (Badalona), year (2016), Indicator (Indicador A), there are 3 possible variables (variable AA, variable AB and variable AC).
When I use the CONCAT function, we can see the result is correct. Appear the three variables.
But I want to go further and I would like to use the CONCAT function to create a conditional sentences to process data.
I add the code inside the separator part in the CONCAT function to create the sentences (we can see the column CONDITIONAL SENTENCES).
The problem is when I execute this code using the $ expansion, It take all the possible values in the graph.
It's like no dimensions exists.
I've tried to use simple sentences like "=Concat (variable_value,'+') " and this return "10+20+30", but when I tried to execute this with "=$(=Concat (variable_value,'+')) " it occurs the same, returning "360" that is the sum of the "variable_value" without regard the dimensions.
I don't know if it's a bug or the CONCAT function has some type of use restrictions.
Can anybody help me?
Thanks in advance.
Accepted Solutions
- Mark as New
- Bookmark
- Subscribe
- Mute
- Subscribe to RSS Feed
- Permalink
- Report Inappropriate Content
AFAIK, this is not a bug and is by design that dollar sign expansion is done once per chart instead of once per dimension....
- Mark as New
- Bookmark
- Subscribe
- Mute
- Subscribe to RSS Feed
- Permalink
- Report Inappropriate Content
AFAIK, this is not a bug and is by design that dollar sign expansion is done once per chart instead of once per dimension....
- Mark as New
- Bookmark
- Subscribe
- Mute
- Subscribe to RSS Feed
- Permalink
- Report Inappropriate Content
Thanks Sunny,
So I've to think another way to do it.