Unlock a world of possibilities! Login now and discover the exclusive benefits awaiting you.
- Qlik Community
- :
- Forums
- :
- Analytics
- :
- New to Qlik Analytics
- :
- Re: How to give name of Legend at Y axis in Qlikse...
- Subscribe to RSS Feed
- Mark Topic as New
- Mark Topic as Read
- Float this Topic for Current User
- Bookmark
- Subscribe
- Mute
- Printer Friendly Page
- Mark as New
- Bookmark
- Subscribe
- Mute
- Subscribe to RSS Feed
- Permalink
- Report Inappropriate Content
How to give name of Legend at Y axis in Qliksense ?
Hi All ,
I am new to Qliksense and was not able to find way to give name of Legend Y axis .
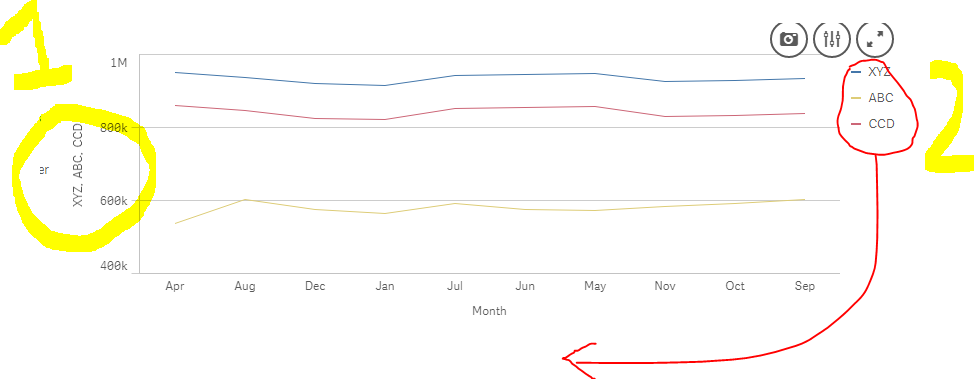
1. I want to display ' Earnings ' at place of 1 (highlighted)
2. Want to Move Expression Labels at bottom of chart .
Thanks & Regards
Shekar
- Mark as New
- Bookmark
- Subscribe
- Mute
- Subscribe to RSS Feed
- Permalink
- Report Inappropriate Content
Hi ,
The legends 2 are nothing but your 2 Dimension values or your expressions labels in case you have one dimension and multiple measures.
For your 1 , you can check the "Appearance ->Presentation " Tabs for the chart properties
- Mark as New
- Bookmark
- Subscribe
- Mute
- Subscribe to RSS Feed
- Permalink
- Report Inappropriate Content
When you have Multiple Measures, at Y axis it will show labels of all 3 measures separated by Comma.
You can change Labels of Measures whatever you need..
It will be in Data Section of Chart.
- Mark as New
- Bookmark
- Subscribe
- Mute
- Subscribe to RSS Feed
- Permalink
- Report Inappropriate Content
Hi Shekar,
For your 1st answer.
In data tab, go in measures and there in Labels, Name whatever you want to be displayed on Left(Y axis)
and in Appearance-> Y axis- > Keep Label & Title as Lable & Title & Position - Left
At your 2 marked position, those are legends. You make its position in Colors & Legends as Top, Bottom, Right,
Hope this solves your problem