Unlock a world of possibilities! Login now and discover the exclusive benefits awaiting you.
- Qlik Community
- :
- Forums
- :
- Analytics
- :
- New to Qlik Analytics
- :
- Re: Weirdest thing I have seen in Qlik Sense to da...
- Subscribe to RSS Feed
- Mark Topic as New
- Mark Topic as Read
- Float this Topic for Current User
- Bookmark
- Subscribe
- Mute
- Printer Friendly Page
- Mark as New
- Bookmark
- Subscribe
- Mute
- Subscribe to RSS Feed
- Permalink
- Report Inappropriate Content
Weirdest thing I have seen in Qlik Sense to date.
So I seem to be experiencing an issue with Qlik Sense as best as I can explain here is what is happening:
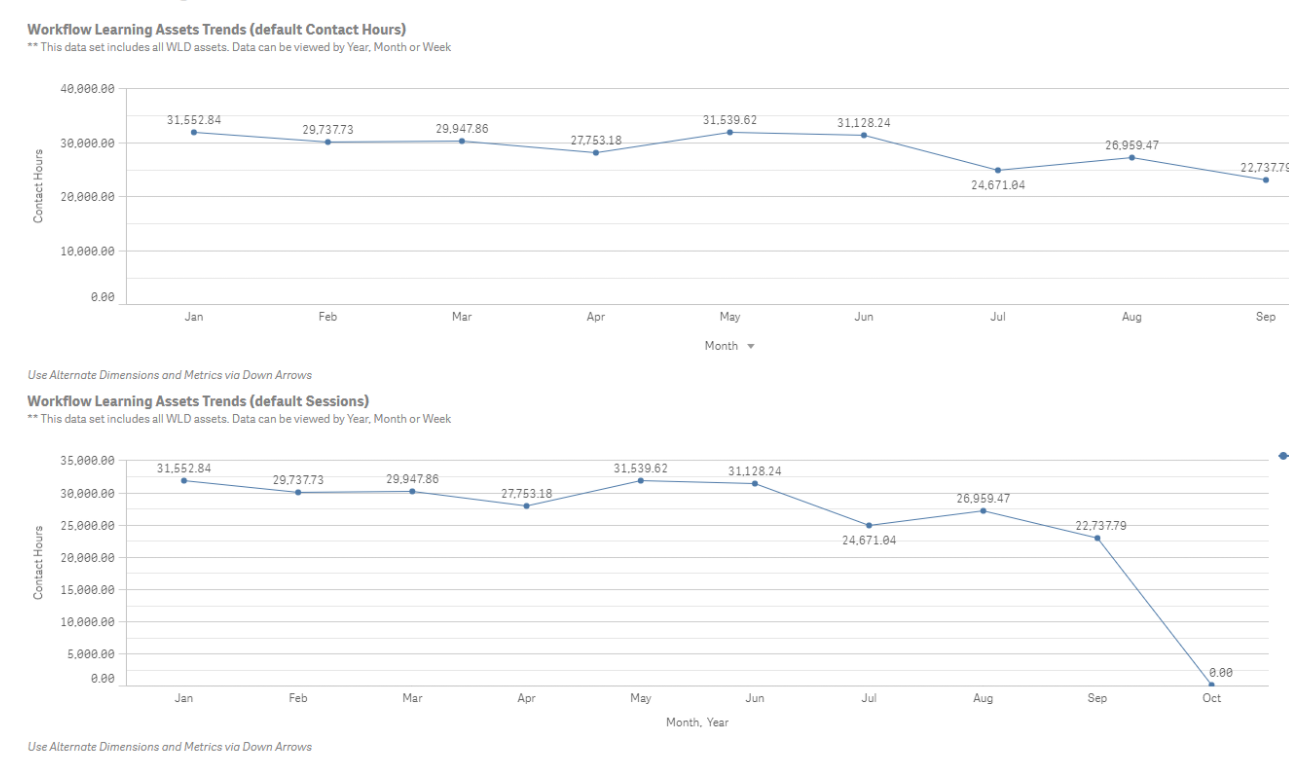
My boss wanted to exclude the current month from being displayed on the line charts but wanted the data to show in tables so it could be analyzed. So with the help of Antonio (see this link Re: Trying to exclude the current month from a line charthttps://community.qlik.com/message/1354188#1354188) we came up with the following formula Sum({$<Date={'<=$(=Date(MonthEnd(Today(),-1),'M/D/YYYY'))'}>} AvgSessionDuration*Sessions)/3600 and it worked like a champ using an exported copy of the original app in Qlik Sense Desktop on my home computer. What I see is a clean break in the current year for September no value displayed at all for October and no line being drawn from September to October all is great in Qlik land.
When I added the single line of code to the actual app which is running on Qlik Sense Enterprise the entire chart disappears as if the formula is so messed up that it can not even display the chart at all.
All the above formula should do is look at todays date and give me the end of the month for the prior month, there by not showing any data in the chart for the current month. Simple enough and like I said it works exactly as I wanted it to in Qlik Sense Desktop but completely fails in Qlik Sense Enterprise.
I loaded up an instance of Qlik Sense Desktop on my laptop and moved a copy of the original app the same one that is used on the Enterprise version and on my home computer and now I get a third completely different chart issue on this version it shows 0 and a line being drawn from the previous month in the line chart.
I have exported the chart from enterprise and moved it over to both my home computer and laptop and back with no difference being noticed in the displaying each issue remains with the machine as I move this app around.
This app has over 100 additional charts, KPI, and tables in it and every single one of them without fail works and looks the same on all three devices. I can not figure the issue out.
Anyone out there have an idea on what could be causing the issue. Open to any and all suggestions as I have spent 3 days looking into it and can find no solution.
- Tags:
- radmin5253
- Mark as New
- Bookmark
- Subscribe
- Mute
- Subscribe to RSS Feed
- Permalink
- Report Inappropriate Content
Pradosh no this did not work either and to you and everyone else who is taking time to help on this I really do thank you I have never seen such a weird thing or such a difficult thing to do for something that would seem so simple.
- Mark as New
- Bookmark
- Subscribe
- Mute
- Subscribe to RSS Feed
- Permalink
- Report Inappropriate Content
All here is an obfuscated version of the app it is distilled down to the bear minimum of only what is needed to produce the chart.
- Mark as New
- Bookmark
- Subscribe
- Mute
- Subscribe to RSS Feed
- Permalink
- Report Inappropriate Content
Could you try
Sum({$<Date = {"<$(=Ceil(MonthEnd(Today(),-1)))"} >} AvgSessionDuration*Sessions)/3600
Seems like your first screenshot bottom chart already misses the date limitation, right?
- Mark as New
- Bookmark
- Subscribe
- Mute
- Subscribe to RSS Feed
- Permalink
- Report Inappropriate Content
I am trying to replicate the top chart in the first screen shot
I tried the formula you sent and it gave me the following see screen shot.

It shows all zero's for every month see bottom chart
- Mark as New
- Bookmark
- Subscribe
- Mute
- Subscribe to RSS Feed
- Permalink
- Report Inappropriate Content
How about this
Sum({$<Date={"=Only({1} Date) < MonthStart(Today())"}>} AvgSessionDuration*Sessions)/3600
- Mark as New
- Bookmark
- Subscribe
- Mute
- Subscribe to RSS Feed
- Permalink
- Report Inappropriate Content
Nope I get the same thing as some of the other formulas see bottom chart

The only way I have been able to get the top chart to display is one to take off the second dimension of year for the line chart and make it an alternate dimension which leaves only Month as the dimension in play and then to hard code the formula date as such Sum({$<Date={'<=9/30/2017'}>}AvgSessionDuration*Sessions)/3600
I am beginning to think that it is an issue with the line chart visual in that if two dimensions are used the last month if excluded will display 0
- Mark as New
- Bookmark
- Subscribe
- Mute
- Subscribe to RSS Feed
- Permalink
- Report Inappropriate Content
Isn't the bottom chart working here?
- Mark as New
- Bookmark
- Subscribe
- Mute
- Subscribe to RSS Feed
- Permalink
- Report Inappropriate Content
It would be if the line from September to October did not show and the 0 did not show for October. What my boss hates is that when he briefs these charts is that he keeps getting asked what happened in month X where X is the current month.
So he does not want it to show the current Month at all not even a line from the previous month to the current month so the first chart is what I am trying to replicate in the second chart.
So when it is all said and done the bottom chart should look like this with no filters applied (see jpg file attached).
- Mark as New
- Bookmark
- Subscribe
- Mute
- Subscribe to RSS Feed
- Permalink
- Report Inappropriate Content
Man I have to say that you guys are creative I am not yet familiar with Ceil or Only I would love a pdf version of the qlik online help or at least all the functions when I look these up they are definitely things I want in my tool box of functions.
- Mark as New
- Bookmark
- Subscribe
- Mute
- Subscribe to RSS Feed
- Permalink
- Report Inappropriate Content
I think that is just a setting that you have to change..
Under Add-Ons -> Data Handling -> Uncheck 'Include Zero Values' to remove 0