Unlock a world of possibilities! Login now and discover the exclusive benefits awaiting you.
- Qlik Community
- :
- Forums
- :
- Analytics
- :
- New to Qlik Analytics
- :
- Re: How to calculate the percentage of counts base...
- Subscribe to RSS Feed
- Mark Topic as New
- Mark Topic as Read
- Float this Topic for Current User
- Bookmark
- Subscribe
- Mute
- Printer Friendly Page
- Mark as New
- Bookmark
- Subscribe
- Mute
- Subscribe to RSS Feed
- Permalink
- Report Inappropriate Content
How to calculate the percentage of counts based on a sub total
Hi
This is very frustrating as a 30 second job in excel and a 2 minute job in Tableau has taken up a couple of hours of my time in Qliksense and I am still no closer to a solution.
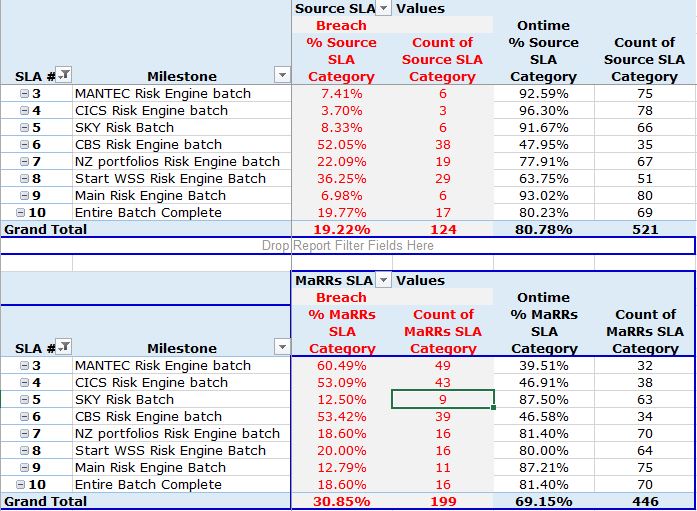
All I want is the % of each type of SLA (Milestone), ie. Source and MaRRS (Reporting tool) that has breached an SLA based on the sub total, for example SLA 10 breach 17/124 = 19.77%. Refer attached
I have tried various different methods for just the denominator before I get to the percentage calc such as aggr and Total and Nodistinct but cannot get any closer to a solution, eg.
- aggr ( Sum ( TOTAL count({1<Status=-{'N/A'}>}Status)) Milestone, Category) = No Values
- count(TOTAL {1<Status=-{'N/A'}>}Status) = 1,290 which is wrong (124 + 521 + 199 +446)
How this cannot be out of the box functionality given we are meant to role this out within our organisation as a self service model is beyond me.
Anyway, any help would be greatly appreciated.
- Mark as New
- Bookmark
- Subscribe
- Mute
- Subscribe to RSS Feed
- Permalink
- Report Inappropriate Content
Here is the qvf
- Mark as New
- Bookmark
- Subscribe
- Mute
- Subscribe to RSS Feed
- Permalink
- Report Inappropriate Content
Appears to be an issue with the auto calendar field that you are using... I created Month field in the script using Binary load and it seems to work with it
=Sum({<[AccessTime.autoCalendar.Date]={">=01/05/2017"},[Category]={'Non Finance'},WeekDay={'Mon','Tue','Wed','Thu','Fri'},Message={'OK'}>}[Duration Seconds])/
Sum({<[AccessTime.autoCalendar.Date]={">=01/05/2017"},[Category]={'Non Finance'},WeekDay={'Mon','Tue','Wed','Thu','Fri'},Message={'OK'}>}
TOTAL <Month> [Duration Seconds])
- Mark as New
- Bookmark
- Subscribe
- Mute
- Subscribe to RSS Feed
- Permalink
- Report Inappropriate Content
I am not as au fait with the the scripting as you so exactly what have you done given the script there is what I have as default?
- Mark as New
- Bookmark
- Subscribe
- Mute
- Subscribe to RSS Feed
- Permalink
- Report Inappropriate Content
Spoke to soon, figured it out Month(AccessTime) as Month.
- Mark as New
- Bookmark
- Subscribe
- Mute
- Subscribe to RSS Feed
- Permalink
- Report Inappropriate Content
Still odd behaviour though given that for pivot table I have to load a Month field but the chart will utilise the existing one from the default Qliksense script. Thanks again.
- Mark as New
- Bookmark
- Subscribe
- Mute
- Subscribe to RSS Feed
- Permalink
- Report Inappropriate Content
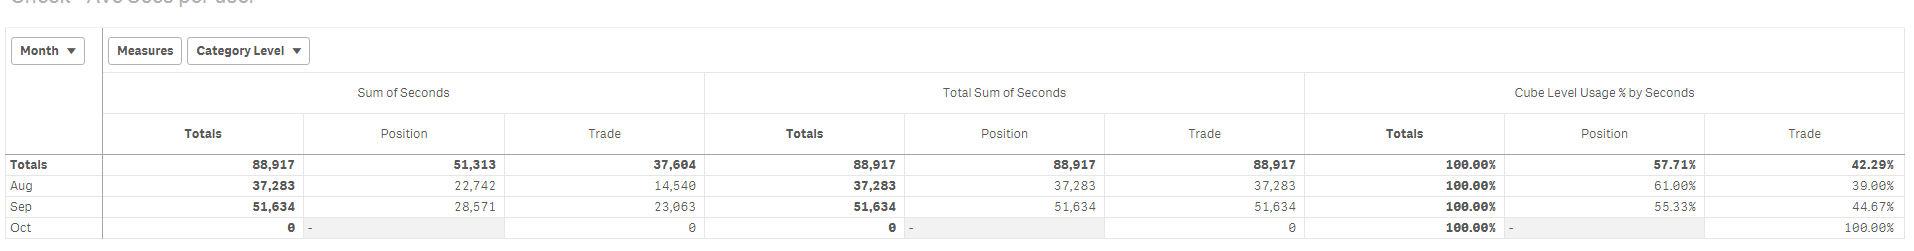
Further testing has found that loading the Month field into the chart does not work properly for Ave secs per user so I would have a different formula for the pivot table and the chart.
For the Count of Report I am still left with the long formula for the % chart as nothing seems to affect that.
- Mark as New
- Bookmark
- Subscribe
- Mute
- Subscribe to RSS Feed
- Permalink
- Report Inappropriate Content
Not sure I understand your concern... I changed the chart dimension from
=Month(Access) to just Month
and change the expression to this
=Sum({<[AccessTime.autoCalendar.Date]={">=01/05/2017"},[Category]={'Non Finance'},WeekDay={'Mon','Tue','Wed','Thu','Fri'},Message={'OK'}>}[Duration Seconds])/
Sum({<[AccessTime.autoCalendar.Date]={">=01/05/2017"},[Category]={'Non Finance'},WeekDay={'Mon','Tue','Wed','Thu','Fri'},Message={'OK'}>}
TOTAL <Month> [Duration Seconds])
Numbers are tieing up, what exactly is the problem?
- Mark as New
- Bookmark
- Subscribe
- Mute
- Subscribe to RSS Feed
- Permalink
- Report Inappropriate Content
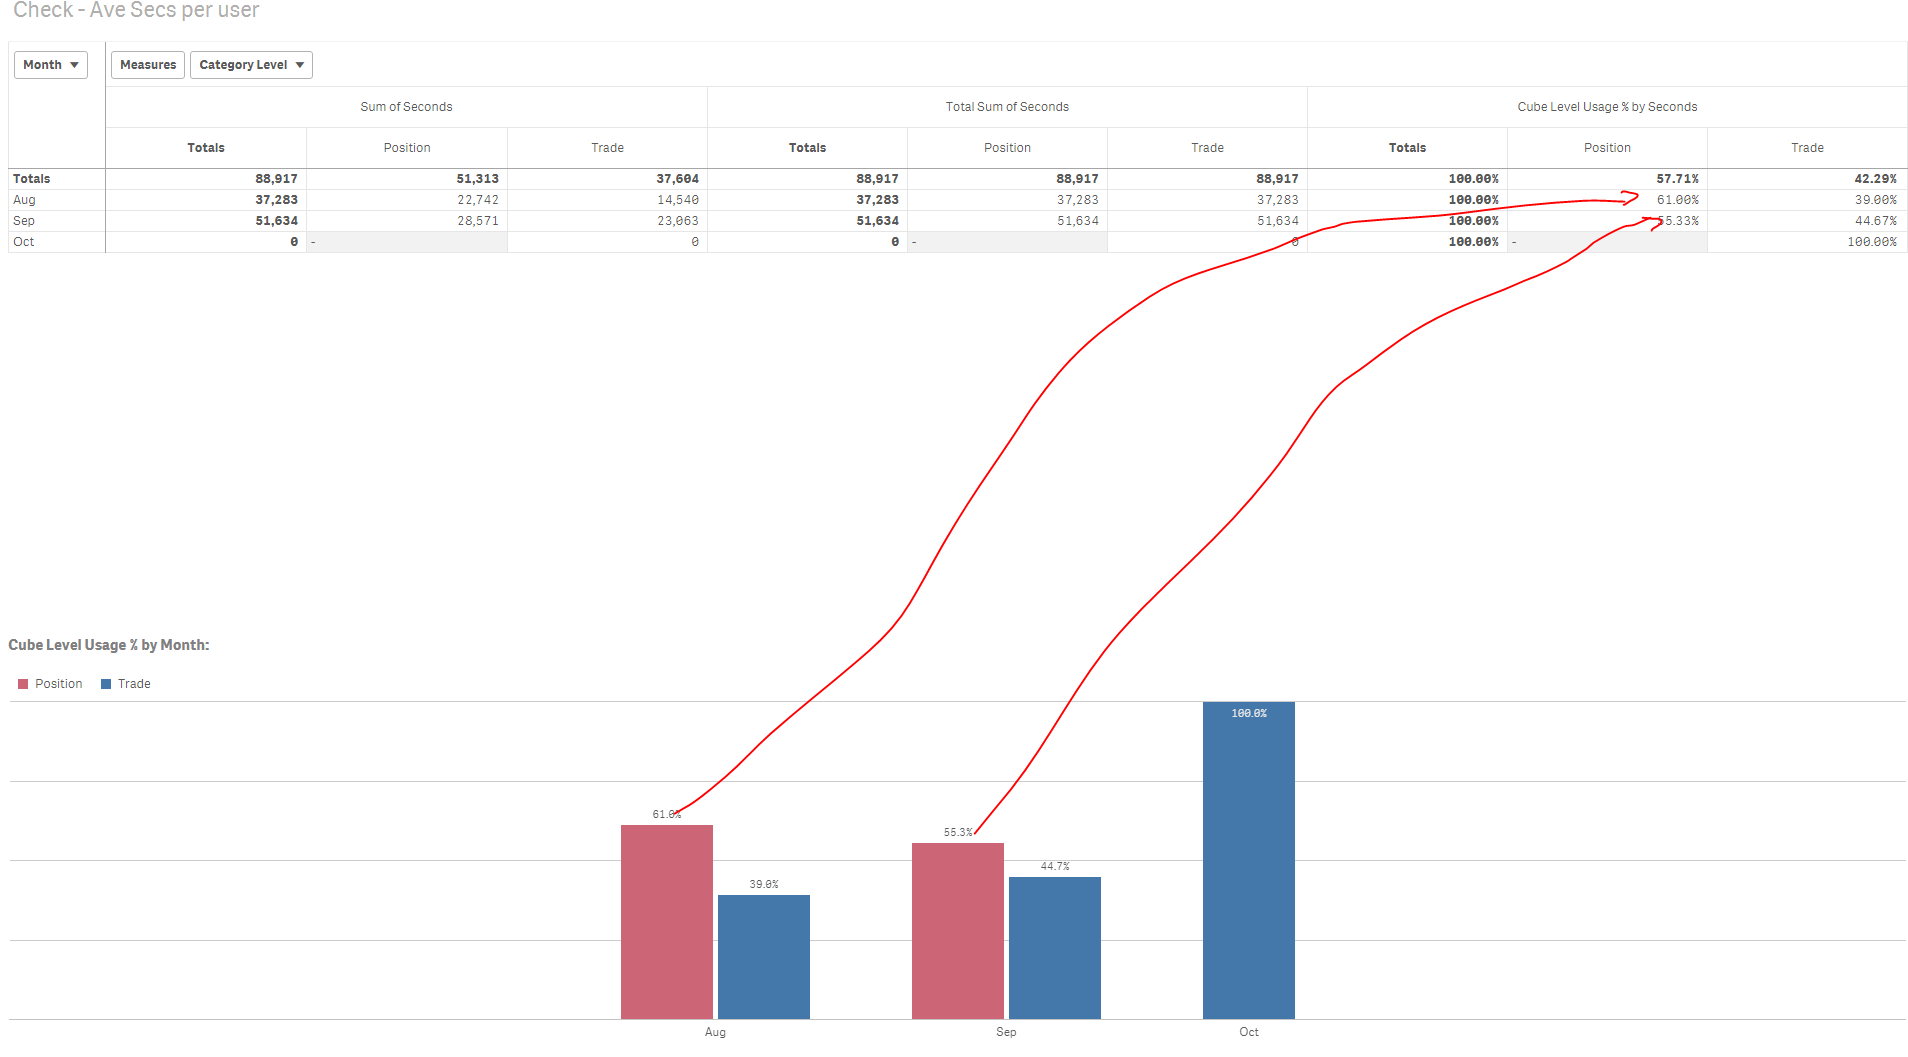
So i just had a play and found that changing my Label from AccessTime.Month to Month changes my values correctly.
I did not think the Label field had any control over the expression.
I loaded the script slightly different to you but at the end of the days it all works. Thanks again.
- Mark as New
- Bookmark
- Subscribe
- Mute
- Subscribe to RSS Feed
- Permalink
- Report Inappropriate Content
That is great.... I am glad it all worked out in the end....
- Mark as New
- Bookmark
- Subscribe
- Mute
- Subscribe to RSS Feed
- Permalink
- Report Inappropriate Content
Any chance you can help me on another expression, pulling my hair out!!! Count and aggregation of variable for the day