Unlock a world of possibilities! Login now and discover the exclusive benefits awaiting you.
- Qlik Community
- :
- Forums
- :
- Analytics
- :
- New to Qlik Analytics
- :
- Re: Master Items and Dates
- Subscribe to RSS Feed
- Mark Topic as New
- Mark Topic as Read
- Float this Topic for Current User
- Bookmark
- Subscribe
- Mute
- Printer Friendly Page
- Mark as New
- Bookmark
- Subscribe
- Mute
- Subscribe to RSS Feed
- Permalink
- Report Inappropriate Content
Master Items and Dates
Hi there!
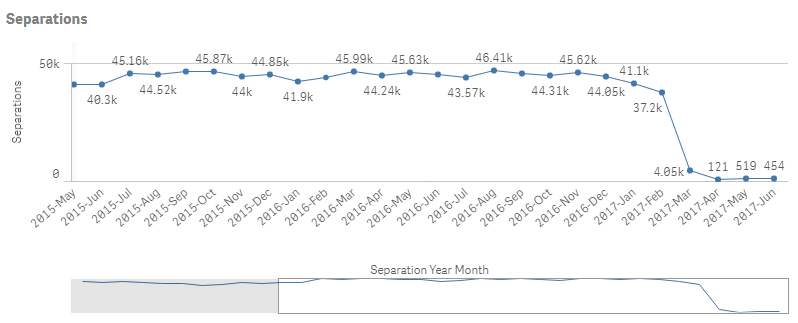
I've created a field to be Dual(Year-Month,MonthStart), then created a master dimension with it just to give a better name and created a simple Bar Chart but the chart wasn't recognising the Dimension as a Date and it looked like this:
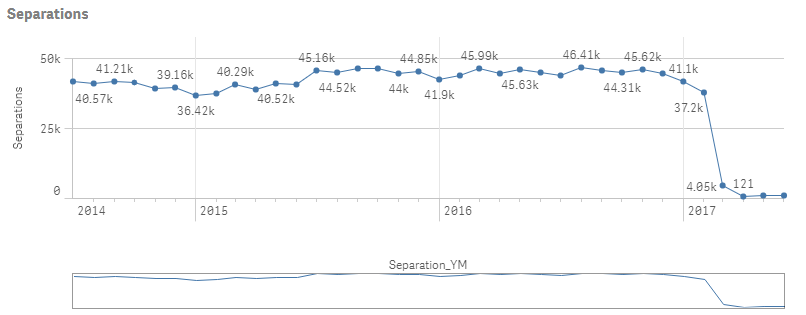
After struggling lots I decided to delete the master item and use the field directly and I got what I was looking for:
Any idea why I can't use the field as a master dimension?
We're using QS Enterprise June 2017
Many thanks
Luis
- Tags:
- master items
Accepted Solutions
- Mark as New
- Bookmark
- Subscribe
- Mute
- Subscribe to RSS Feed
- Permalink
- Report Inappropriate Content
Hi, just realised that I was creating the master dimension using the fx function which places an = sign in front of the field. This, I assume, only moves the string value of the field to the master dimension and not the numeric (date) part of the dual definition.
When I create the master dimension by just selecting the table and field from the left hand side of the dialog box, then the field is passed without the equal sign, which, I assume, enables the master dimension, to fully capture the dual properties of the field.
Regards,
Luis
- Mark as New
- Bookmark
- Subscribe
- Mute
- Subscribe to RSS Feed
- Permalink
- Report Inappropriate Content
What do you mean by "wasn't recognising the Dimension as a Date"? As far as i can see, the dimension values on the first example look correct. Please explain precisely what you are trying to do and why the chart in the first example does not meet your requirements.
- Mark as New
- Bookmark
- Subscribe
- Mute
- Subscribe to RSS Feed
- Permalink
- Report Inappropriate Content
Thanks Jonathan,
I posted this mainly to try to understand the difference between using a date field via a master dimension vs. just using the date field. The behaviour on the charts is different and even the properties I get for Data and and X-axis are a bit different.
In terms of behaviour: when in the chart where the x-axis is properly recognised as a date you can position the cursor over the chart and with the mouse wheel scroll in to a lover level of detail, from year to month. When the x-axis is not recognised as a date, you won't get that behaviour, the mouse wheel will take you left and right to cover the whole range of dates.
Regards,
Luis
- Mark as New
- Bookmark
- Subscribe
- Mute
- Subscribe to RSS Feed
- Permalink
- Report Inappropriate Content
Hi,
It seems there are some conditions for a time-aware chart.
Time aware charts: http://help.qlik.com/en-US/sense/June2017/Content/Videos/Videos-time-aware-charts.htm
Although the issue for me remains: When I create Master Item Dimension based on that field, the line chart (before I said it was a bar chart) does not seem be "aware" that it is a date field. When I delete it from Master Dimensions, then the chart becomes aware of it. In fact the "Use Continuous Scale" checkbox becomes greyed out when I use the field under a master dimension
- Mark as New
- Bookmark
- Subscribe
- Mute
- Subscribe to RSS Feed
- Permalink
- Report Inappropriate Content
Hi, just realised that I was creating the master dimension using the fx function which places an = sign in front of the field. This, I assume, only moves the string value of the field to the master dimension and not the numeric (date) part of the dual definition.
When I create the master dimension by just selecting the table and field from the left hand side of the dialog box, then the field is passed without the equal sign, which, I assume, enables the master dimension, to fully capture the dual properties of the field.
Regards,
Luis