Unlock a world of possibilities! Login now and discover the exclusive benefits awaiting you.
- Qlik Community
- :
- All Forums
- :
- QlikView App Dev
- :
- Re: Line graph with cumulative warehouse rotation
- Subscribe to RSS Feed
- Mark Topic as New
- Mark Topic as Read
- Float this Topic for Current User
- Bookmark
- Subscribe
- Mute
- Printer Friendly Page
- Mark as New
- Bookmark
- Subscribe
- Mute
- Subscribe to RSS Feed
- Permalink
- Report Inappropriate Content
Line graph with cumulative warehouse rotation
Hi.
I have a line chart that shows me the last 12 months of rotation, but when I filter the year '2016' it does not match the original chart for the past 3 months.
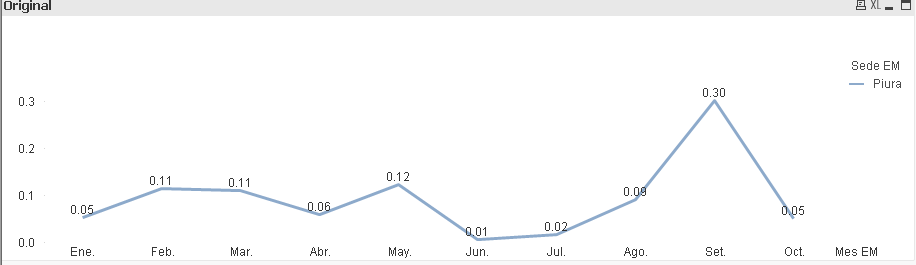
This image is the original graphic of the headquarters Piura and year 2017, compared with the graph of 12 months with the Sede Piura filter and if it coincides in the year 2017.
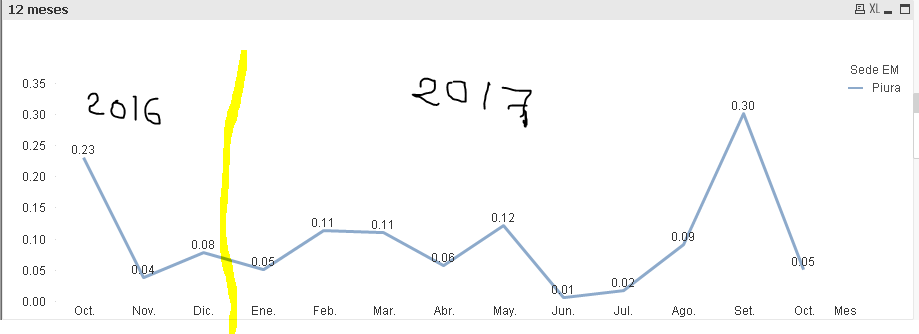
Now filter the piura seat and the year 2016 in the original chart.

and does not match.
Please help me with this topic.
Greetings.
Attached my qvw.
Do not forget to mark as "Accepted Solution" the comment that resolves the doubt.
Accepted Solutions
- Mark as New
- Bookmark
- Subscribe
- Mute
- Subscribe to RSS Feed
- Permalink
- Report Inappropriate Content
This logic solved the problem.
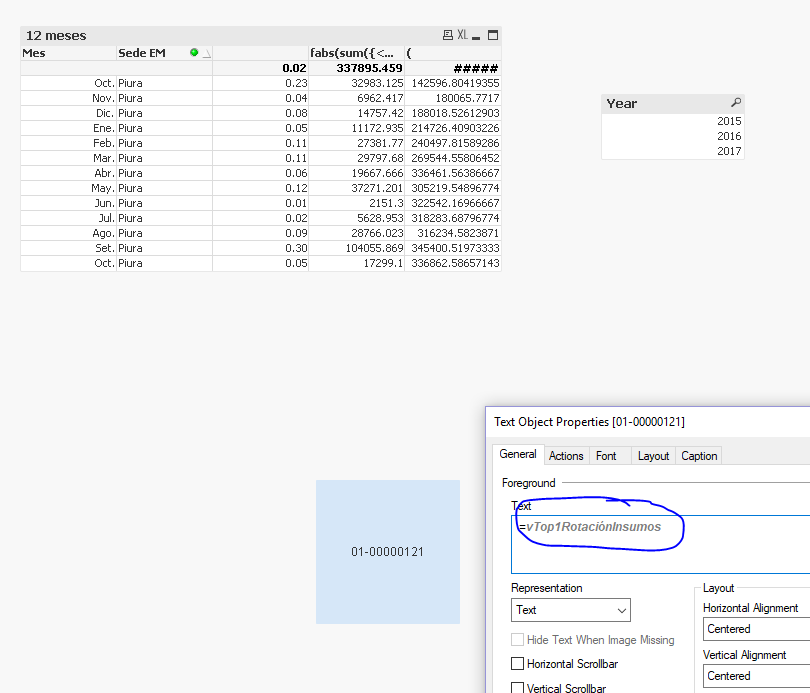
fabs(sum({<[Tipo Movimiento]={'Salida'},[Almacén EM] ={'*'}-{''},[Material EM]={"$(=vTop1RotaciónInsumos)"}, [Fecha EM] = {"$(='>=' &date(interval(AddMonths(Max([Fecha EM]), -12)-(Day(date(interval(AddMonths(Max([Fecha EM]),-12),'D')))-1),'D'),'DD/MM/YYYY')& '<=' & Max([Fecha EM]))"}>}MSEG.Cantidad_MENGE))
/
(
Sum({1<[Fecha EM] = {"$(='>=' &date(interval(AddMonths(Max([Fecha EM]), -12)-(Day(date(interval(AddMonths(Max([Fecha EM]),-12),'D')))-1),'D'),'DD/MM/YYYY')& '<=' & Max([Fecha EM]))"}>} Aggr(RangeSum(Above(Sum({<[Fecha EM], [Año EM],[Mes EM], Year, Month,[Material EM]={"$(=vTop1RotaciónInsumos)"}>}MSEG.Cantidad_MENGE) + Avg({1} 0), 0, RowNo())) ,[Sede EM],([Fecha EM],(NUMERIC,ASCENDING))))
/ Day(Max({1}[Fecha EM]))
)
Thanks for the help Sunny.
Do not forget to mark as "Accepted Solution" the comment that resolves the doubt.
- Mark as New
- Bookmark
- Subscribe
- Mute
- Subscribe to RSS Feed
- Permalink
- Report Inappropriate Content
This variable changes when you make selection for 2016 in the year field.... do you not wish for this variable to change?
- Mark as New
- Bookmark
- Subscribe
- Mute
- Subscribe to RSS Feed
- Permalink
- Report Inappropriate Content
If it is ok to change, as it shows the top 1 of materials depending on the date selected
Do not forget to mark as "Accepted Solution" the comment that resolves the doubt.
- Mark as New
- Bookmark
- Subscribe
- Mute
- Subscribe to RSS Feed
- Permalink
- Report Inappropriate Content
So, if that information changes, then your number's are def. going to change because as your select 2016, you are not viewing the lines for another material (not the same one as the one you were looking at without selection).
Does this make sense?
- Mark as New
- Bookmark
- Subscribe
- Mute
- Subscribe to RSS Feed
- Permalink
- Report Inappropriate Content
So is. Change the values according to the material.
In the original graph came out with this logic.
fabs(sum({<[Tipo Movimiento]={'Salida'},[Almacén EM] ={'*'}-{''},[Material EM]={"$(=vTop1RotaciónInsumos)"}, [Fecha EM] = {"$(='>=' &AddMonths(Max([Fecha EM]), -12)-1& '<=' & Max([Fecha EM]))"}>}MSEG.Cantidad_MENGE))
/
(
Sum({1<[Fecha EM] = {"$(='>=' & AddMonths(Max([Fecha EM]), -12)-1 & '<=' & Max([Fecha EM]))"}>} Aggr(RangeSum(Above(Sum({<[Fecha EM], [Año EM],[Mes EM], Year, Month,[Material EM]={"$(=vTop1RotaciónInsumos)"}>}MSEG.Cantidad_MENGE) + Avg({1} 0), 0, RowNo())) ,[Sede EM],([Fecha EM],(NUMERIC,ASCENDING))))
/ Day(Max({1}[Fecha EM]))
)
subtract '1' to date minimum without date format.
But now it comes out every month.

I would like to visualize only the last 13 months without changing the expression.
The change could be in the Dimension tab or the sort tab.

Do not forget to mark as "Accepted Solution" the comment that resolves the doubt.
- Mark as New
- Bookmark
- Subscribe
- Mute
- Subscribe to RSS Feed
- Permalink
- Report Inappropriate Content
This logic solved the problem.
fabs(sum({<[Tipo Movimiento]={'Salida'},[Almacén EM] ={'*'}-{''},[Material EM]={"$(=vTop1RotaciónInsumos)"}, [Fecha EM] = {"$(='>=' &date(interval(AddMonths(Max([Fecha EM]), -12)-(Day(date(interval(AddMonths(Max([Fecha EM]),-12),'D')))-1),'D'),'DD/MM/YYYY')& '<=' & Max([Fecha EM]))"}>}MSEG.Cantidad_MENGE))
/
(
Sum({1<[Fecha EM] = {"$(='>=' &date(interval(AddMonths(Max([Fecha EM]), -12)-(Day(date(interval(AddMonths(Max([Fecha EM]),-12),'D')))-1),'D'),'DD/MM/YYYY')& '<=' & Max([Fecha EM]))"}>} Aggr(RangeSum(Above(Sum({<[Fecha EM], [Año EM],[Mes EM], Year, Month,[Material EM]={"$(=vTop1RotaciónInsumos)"}>}MSEG.Cantidad_MENGE) + Avg({1} 0), 0, RowNo())) ,[Sede EM],([Fecha EM],(NUMERIC,ASCENDING))))
/ Day(Max({1}[Fecha EM]))
)
Thanks for the help Sunny.
Do not forget to mark as "Accepted Solution" the comment that resolves the doubt.