Unlock a world of possibilities! Login now and discover the exclusive benefits awaiting you.
- Qlik Community
- :
- All Forums
- :
- QlikView App Dev
- :
- Set Analysis - overall sum by month
- Subscribe to RSS Feed
- Mark Topic as New
- Mark Topic as Read
- Float this Topic for Current User
- Bookmark
- Subscribe
- Mute
- Printer Friendly Page
- Mark as New
- Bookmark
- Subscribe
- Mute
- Subscribe to RSS Feed
- Permalink
- Report Inappropriate Content
Set Analysis - overall sum by month
Hi,
Please see the table below:
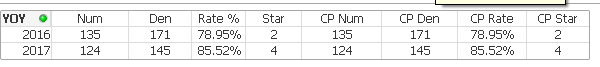
For the Num column I am currently using this expression to sum the PHARM_NUM_STATUS based on selections and to show a YOY comparison and it is working.
=Sum({<PHARM_Year, PHARM_MonthNum = {"=PHARM_MonthNum = Max(TOTAL <PHARM_Year> Aggr(PHARM_MonthNum, PHARM_Year))"}>} PHARM_NUM_STATUS)
But now for the CP Num column I am needing to show the overall sum of all data as a comparison, even when a selection is made. I tried
=Sum({<PHARM_Year, PHARM_MonthNum = {"=PHARM_MonthNum = Max(TOTAL <PHARM_Year> Aggr(PHARM_MonthNum, PHARM_Year))"}>} {1}PHARM_NUM_STATUS)
but this is summing all PHARM_NUM_STATUS for the entire year.
Any help is appreciated.
- « Previous Replies
-
- 1
- 2
- Next Replies »
Accepted Solutions
- Mark as New
- Bookmark
- Subscribe
- Mute
- Subscribe to RSS Feed
- Permalink
- Report Inappropriate Content
May be this
=Sum({<GROUPER_NAME, PHARM_Year, PHARM_MonthNum = {"=PHARM_MonthNum = Max(TOTAL <PHARM_Year> Aggr(PHARM_MonthNum, PHARM_Year))"}>} PHARM_NUM_STATUS)
- Mark as New
- Bookmark
- Subscribe
- Mute
- Subscribe to RSS Feed
- Permalink
- Report Inappropriate Content
May be this
=Sum({1<PHARM_MonthNum = {"=Only({1} PHARM_MonthNum) = Max({1}TOTAL <PHARM_Year> Aggr(Only({1} PHARM_MonthNum), PHARM_Year))"}>} PHARM_NUM_STATUS)
- Mark as New
- Bookmark
- Subscribe
- Mute
- Subscribe to RSS Feed
- Permalink
- Report Inappropriate Content
Thank you, but that is returning 0's for both 2016 and 2017.
- Mark as New
- Bookmark
- Subscribe
- Mute
- Subscribe to RSS Feed
- Permalink
- Report Inappropriate Content
Would you be able to share a sample to look at this?
- Mark as New
- Bookmark
- Subscribe
- Mute
- Subscribe to RSS Feed
- Permalink
- Report Inappropriate Content
Sure, here you go. The total CP Num for 2016 should be 117,483 and for 2017 = 117,199. But, I would like those numbers to change based on the type (Diabetes, RAS, Statin) and months chosen. Thank you!!
- Mark as New
- Bookmark
- Subscribe
- Mute
- Subscribe to RSS Feed
- Permalink
- Report Inappropriate Content
May be this
=Sum({<GROUPER_NAME, PHARM_Year, PHARM_MonthNum = {"=PHARM_MonthNum = Max(TOTAL <PHARM_Year> Aggr(PHARM_MonthNum, PHARM_Year))"}>} PHARM_NUM_STATUS)
- Mark as New
- Bookmark
- Subscribe
- Mute
- Subscribe to RSS Feed
- Permalink
- Report Inappropriate Content
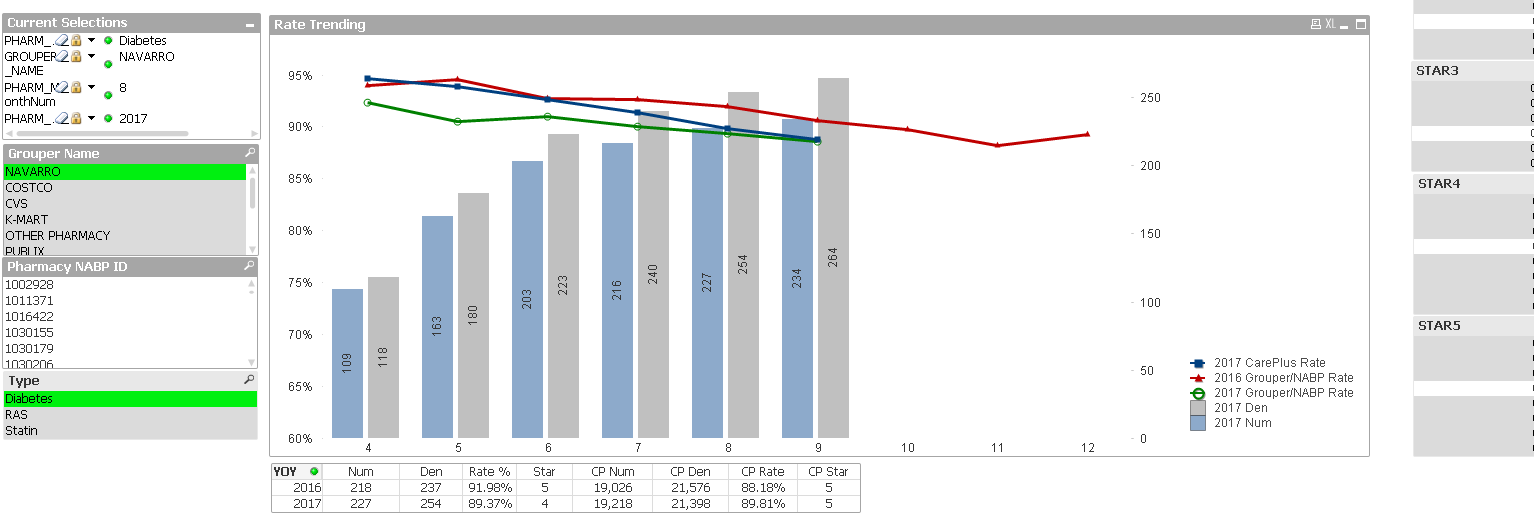
Thank you, it is working! I am now having an issue I think with the Star value.... You can see for the 2017 Star it is saying 4, but the rate = 89.37% and to the right you can see the STAR 5 threshold is 89%, so it should be a 5... I am not sure why it is reading this wrong. I've attached a new app so you can see what I mean.
- Mark as New
- Bookmark
- Subscribe
- Mute
- Subscribe to RSS Feed
- Permalink
- Report Inappropriate Content
When I open your dashboard, I see this

Which selections bring me to those results 89.37% and 4?
- Mark as New
- Bookmark
- Subscribe
- Mute
- Subscribe to RSS Feed
- Permalink
- Report Inappropriate Content
Grouper Name = Navarro, Type = Diabetes, Month = 8, and Year = 2017. Then you can see down in the YOY table the 89.37% Rate and 4 Star value. But the list boxes to the right show the STAR 5 threshold being 89%, so the Star should = 5 instead of 4.
- Mark as New
- Bookmark
- Subscribe
- Mute
- Subscribe to RSS Feed
- Permalink
- Report Inappropriate Content
Same selection as you mentioned shows me 89.81% for CP Rate and 5 for CP Star
- « Previous Replies
-
- 1
- 2
- Next Replies »