Unlock a world of possibilities! Login now and discover the exclusive benefits awaiting you.
- Qlik Community
- :
- Forums
- :
- Analytics
- :
- New to Qlik Analytics
- :
- Re: Previous month data on this month row
- Subscribe to RSS Feed
- Mark Topic as New
- Mark Topic as Read
- Float this Topic for Current User
- Bookmark
- Subscribe
- Mute
- Printer Friendly Page
- Mark as New
- Bookmark
- Subscribe
- Mute
- Subscribe to RSS Feed
- Permalink
- Report Inappropriate Content
Previous month data on this month row
Hi all,
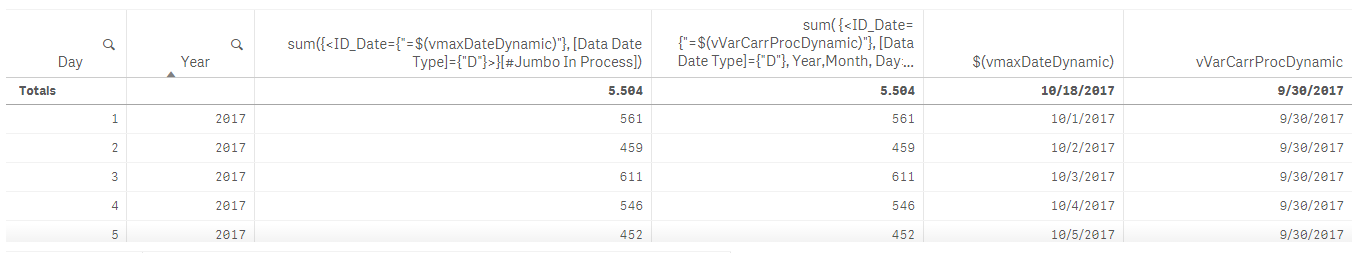
I have a table where I want to show the following expression:
sum({<ID_Date={"=$(vmaxDateDynamic)"}, [Data Date Type]={"D"}>}[#Jumbo In Process])
-
sum( {<ID_Date={"=$(vVarCarrProcDynamic)"}, [Data Date Type]={"D"}>}[#Jumbo In Process])
The dates being shown in the table are correct, and the first expression is correct. However, the second expression keeps returning the value for the Day and Month in that row of the table, and not for the date I am selecting through the variable.
I already tried to ignore Year, Month and Day and it didn't work. Total will also show me the value for the entire month which is not the desired, so it doesn't work.
Any ideas?
Thanks in advance.
Regards,
- « Previous Replies
-
- 1
- 2
- Next Replies »
- Mark as New
- Bookmark
- Subscribe
- Mute
- Subscribe to RSS Feed
- Permalink
- Report Inappropriate Content
hi
may be using a date related field as a dimesnsion is causing the issue.
try adding this next to year column and share the result for that.
sum({< [Data Date Type]={"D"}>}[#Jumbo In Process])
- Mark as New
- Bookmark
- Subscribe
- Mute
- Subscribe to RSS Feed
- Permalink
- Report Inappropriate Content
Try this
Sum(TOTAL {<ID_Date = {"$(=Num($(vVarCarrProcDynamic)))"}, [Data Date Type]={"D"}, Year, Month>}[#Jumbo In Process]) * Avg({<[Data Date Type]={"D"}>}1)
- Mark as New
- Bookmark
- Subscribe
- Mute
- Subscribe to RSS Feed
- Permalink
- Report Inappropriate Content
Now it's returning the same values for all years and all months, and the idea is to return a different value for each month, year, and day.
- Mark as New
- Bookmark
- Subscribe
- Mute
- Subscribe to RSS Feed
- Permalink
- Report Inappropriate Content
But I thought you wanted to see 9/30/2017 value? Isn't that what the set analysis was for?
- Mark as New
- Bookmark
- Subscribe
- Mute
- Subscribe to RSS Feed
- Permalink
- Report Inappropriate Content
No, it's for each month, the value in the last column. In case of October yes, it's 9/30/2017, but for the other months, it's a different date.
- Mark as New
- Bookmark
- Subscribe
- Mute
- Subscribe to RSS Feed
- Permalink
- Report Inappropriate Content
So you are not going to be looking at this one month at a time?
- Mark as New
- Bookmark
- Subscribe
- Mute
- Subscribe to RSS Feed
- Permalink
- Report Inappropriate Content
Yes.
- Mark as New
- Bookmark
- Subscribe
- Mute
- Subscribe to RSS Feed
- Permalink
- Report Inappropriate Content
Hello Ines,
set analysis is calculated before data is aggregated by dimension values, therefore you are not able to display value for 9/30/2017 on a row with dimension value for 10/1/2017. From your screenshot I assume your second expression should always display value for end of previous month, so maybe you can put that whole expression into a variable like this
vSecondExp = '=sum( {<ID_Date={"=$(vVarCarrProcDynamic)"}, [Data Date Type]={"D"}>}[#Jumbo In Process])'
and then use
$(vSecondExp)
as your expression. This will calculate the corresponding value before calculating the chart itself. If my assumption is correct, than this should work.
Best
Juraj
- Mark as New
- Bookmark
- Subscribe
- Mute
- Subscribe to RSS Feed
- Permalink
- Report Inappropriate Content
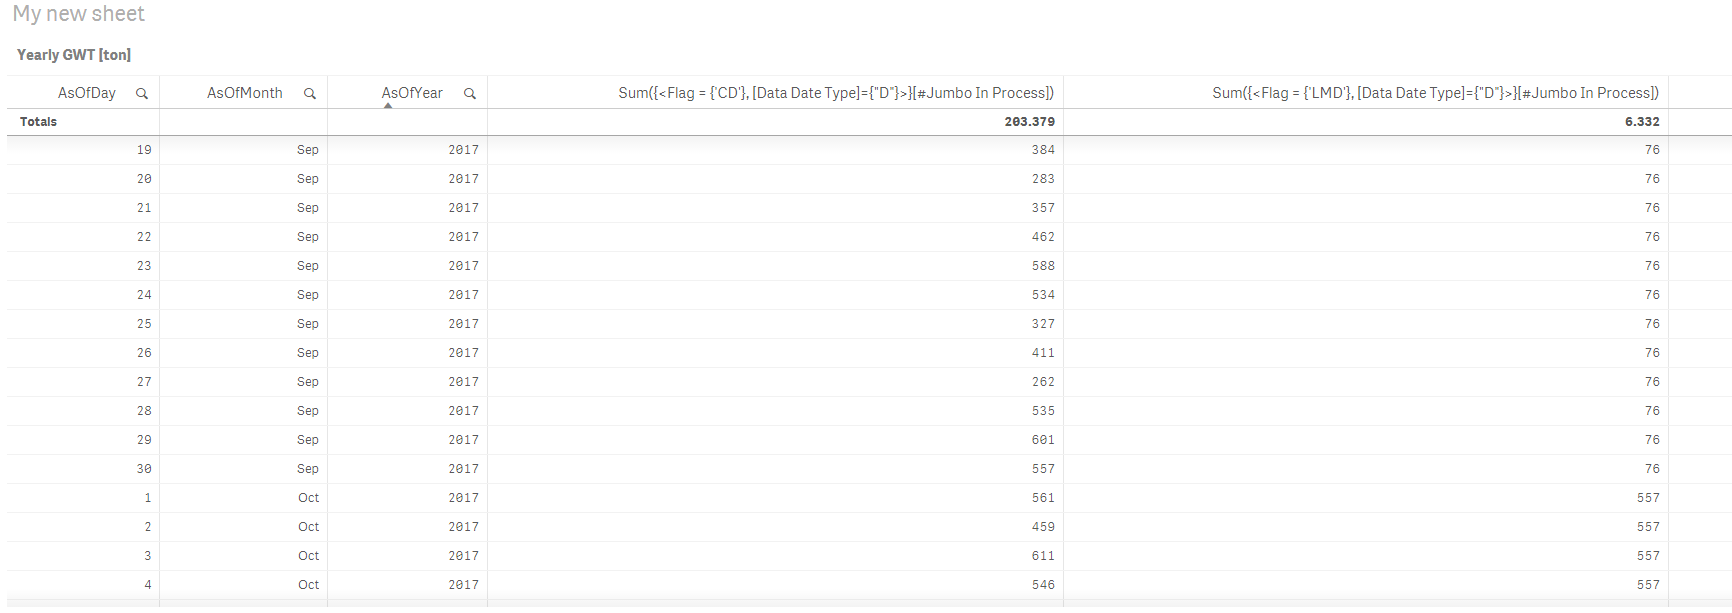
I would suggest using The As-Of Table for this
- Mark as New
- Bookmark
- Subscribe
- Mute
- Subscribe to RSS Feed
- Permalink
- Report Inappropriate Content
Try this script
[Fact Table]:
LOAD
ID_Date,
"Data Date Type",
"#Jumbo In Process"
FROM [lib://QVD Folder/Fact Table.qvd]
(qvd)
where "Fact Type" = 'PM' and "Site Machine Code"= 'FIG-PM1';
Calendar:
LOAD
ID_Date,
"Date",
"Day",
"Week",
"Month",
Quarter,
Semester,
"Year",
"Year-Quarter",
"Year-Semester",
"Year-Month",
"Year Month ID",
MonthNum,
vDateMax
FROM [lib://QVD Folder/Calendar.qvd]
(qvd);
AsOfTable:
LOAD DISTINCT ID_Date as AsOfDate,
Day(ID_Date) as AsOfDay,
Month(ID_Date) as AsOfMonth,
Year(ID_Date) as AsOfYear,
ID_Date,
'CD' as Flag
Resident [Fact Table];
Concatenate(AsOfTable)
LOAD DISTINCT ID_Date as AsOfDate,
Day(ID_Date) as AsOfDay,
Month(ID_Date) as AsOfMonth,
Year(ID_Date) as AsOfYear,
Floor(MonthEnd(ID_Date, -1)) as ID_Date,
'LMD' as Flag
Resident [Fact Table];
And then this:
Dimension
AsOfDay
AsOfMonth
AsOfYear
Expressions
Sum({<Flag = {'CD'}, [Data Date Type]={"D"}>}[#Jumbo In Process])
Sum({<Flag = {'LMD'}, [Data Date Type]={"D"}>}[#Jumbo In Process])
- « Previous Replies
-
- 1
- 2
- Next Replies »