Unlock a world of possibilities! Login now and discover the exclusive benefits awaiting you.
- Qlik Community
- :
- All Forums
- :
- QlikView App Dev
- :
- Re: Date problem in combination with Sales and Bud...
- Subscribe to RSS Feed
- Mark Topic as New
- Mark Topic as Read
- Float this Topic for Current User
- Bookmark
- Subscribe
- Mute
- Printer Friendly Page
- Mark as New
- Bookmark
- Subscribe
- Mute
- Subscribe to RSS Feed
- Permalink
- Report Inappropriate Content
Date problem in combination with Sales and Budget tables
Hello,
I have a Date problem in combination with my Sales and Budget tables
I have a table TaskForcePlan with my budgetvalues per day. I have also a table Sales with my salesvalues per day. In fact I have two measure or main tables.
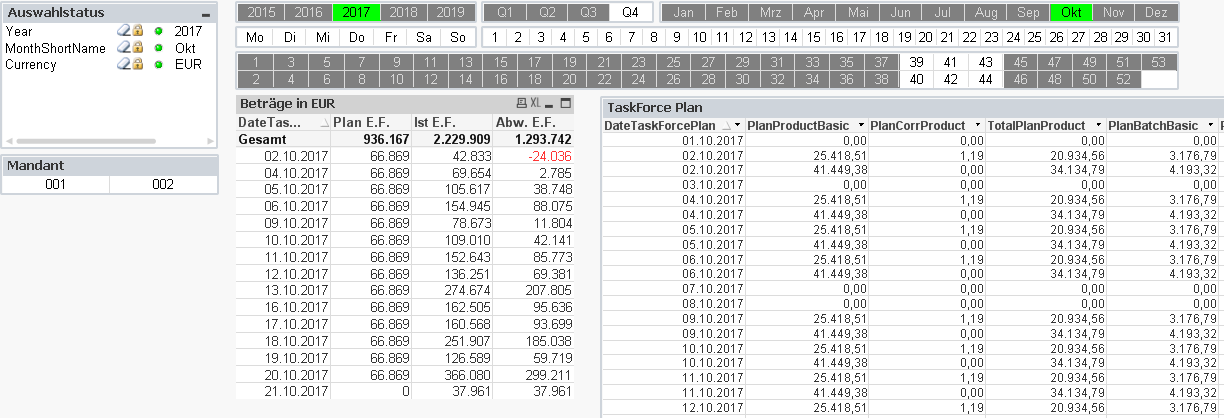
I have made a straighttable with dimension DateTaskForcePlan from the table TaskForcePlan and three expressions:
One for Budget: Sum({$ < Year = {$(= max(Year))} > } (PlanProductBasic + PlanCorrProduct))
One for Sales: Sum({$ < Year = {$(= max(Year))} > } ProductValue)
One for the difference: Sum({$ < Year = {$(= max(Year))} > } ProductValue) -
Sum({$ < Year = {$(= max(Year))} > } (PlanProductBasic + PlanCorrProduct))
When I combine both tables with my calendar Daygrid I have three options
First option is to define the date-fields in both tables as Date
Second option to define the date-field in my budgettable as Date and define a key (company-date) between both tables
Third option to define the date-field in my salestable (facttable) as Date and define a key (company-date) between both tables
The first and second option has as result that I see al dates with budget and/or sales, as example is 15/06/2017 which has a budget but no sales. Other result is that when I select Oct. as month I see all budget till the end of month.
The third option has as result that I only the dates when there are sales for that day, so for Oct. I don’t see all budget till the end of the month, but days with budget and no sales like the example 15/06/2017 are not shown either. So the values for the month Juni are not correct.
I have added two QVW’s, one with the first option and the second with option three.
What I need is a straight table showing all dates with values for Budget and/or Sales and where in the current month only until the current day is shown: so when no month is selected all until today, when a month is selected only the days of that month and when October is selected all days with values until today.:
Examples :
- 11/03/2017 has no budget but sales: so day has to be shown
- 15/05/2017 has budget and sales: so day has to be shown
- 15/06/2017 has budget but no sales: so day has to be shown
- 30/10/2017 has budget, no sales but lays in the future: so day has not to be shown
When a day has no budget and no sales values like in weekends, that day should not be shown.
I tried to add a key table with the different Dates as keyfields, but that gives the same result as described in Option one. I made one big table by using two left join where my daygrid was leading, but that costs performance and is no solution for Problems like example 4. I also looked in other questions/solutions here, but I didn't find a real solution for my Problem. Perhaps a change in my expressions can fix my problem, I don't know.
So I hope someone can tell me which option is the best and how I should change my dimensions, expressions and relations between the tables to get the straight table I need (as described).
Thanks in advance
Regards
Court.
- Mark as New
- Bookmark
- Subscribe
- Mute
- Subscribe to RSS Feed
- Permalink
- Report Inappropriate Content
So, I tried looking at the two qvws you have attached... Both have them have three charts, which chart are we looking at? or are we looking at all three of them?
- Mark as New
- Bookmark
- Subscribe
- Mute
- Subscribe to RSS Feed
- Permalink
- Report Inappropriate Content
Hello Sunny,
The two on the right (Taskforce Plan and Taskforce Sales) are tableboxes, I added them to show the different dates and values.
The left table is the straight table and the table of my application, so that is the Chart we are looking at. This tables combines the Budget and Sales values.
- Mark as New
- Bookmark
- Subscribe
- Mute
- Subscribe to RSS Feed
- Permalink
- Report Inappropriate Content
Used these expressions in your first qvw
=If(DateTaskForcePlan <= Max(TOTAL {<ProductValue = {"*"}>}DateTaskForcePlan), Sum({$ < Year = {$(= max(Year))} > } (PlanProductBasic + PlanCorrProduct)))
= Sum({$ < Year = {$(= max(Year))} > } ProductValue)
= Sum({$ < Year = {$(= max(Year))} > } ProductValue) -
If(DateTaskForcePlan <= Max(TOTAL {<ProductValue = {"*"}>}DateTaskForcePlan), Sum({$ < Year = {$(= max(Year))} > } (PlanProductBasic + PlanCorrProduct)))
- Mark as New
- Bookmark
- Subscribe
- Mute
- Subscribe to RSS Feed
- Permalink
- Report Inappropriate Content
Thanks Sunny, I will check it tomorrow,
- Mark as New
- Bookmark
- Subscribe
- Mute
- Subscribe to RSS Feed
- Permalink
- Report Inappropriate Content
Hello Sunny,
It works, thanks