Unlock a world of possibilities! Login now and discover the exclusive benefits awaiting you.
- Qlik Community
- :
- Forums
- :
- Analytics
- :
- App Development
- :
- Re: Problem summing an average in pivot table
- Subscribe to RSS Feed
- Mark Topic as New
- Mark Topic as Read
- Float this Topic for Current User
- Bookmark
- Subscribe
- Mute
- Printer Friendly Page
- Mark as New
- Bookmark
- Subscribe
- Mute
- Subscribe to RSS Feed
- Permalink
- Report Inappropriate Content
Problem summing an average in pivot table
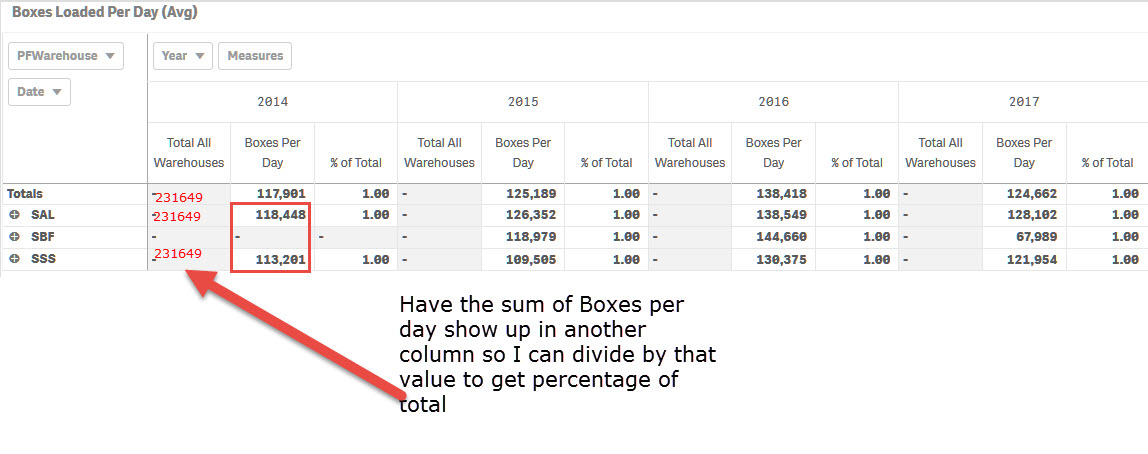
I have a pivot table with a measure that calculates the average number of boxes shipped per day by each warehouse. I'd like to get a sum of those averages by warehouse so I can then do a percentage of total calculation. The current expression to get average of boxes per day is:
Avg(Aggr(Sum({$<RecordType={"LOAD"}>} UnitsLoaded),Date))
I've tried modifying that expression in order to get the total for all warehouses but haven't been able to get any variations to work as I expect.
Avg(Aggr(Sum({$<RecordType={"LOAD"},Warehouse=>} UnitsLoaded),Date))
Avg(Aggr(Sum({1<RecordType={"LOAD"}>} UnitsLoaded),Date))
Sum(Aggr(Avg({$<RecordType={"LOAD"}>} UnitsLoaded),Date))
etc.
- Mark as New
- Bookmark
- Subscribe
- Mute
- Subscribe to RSS Feed
- Permalink
- Report Inappropriate Content
Hi Mike
I think I found the expression you're looking for, please check out the attachment and see if it suits your problem.
The expression I used is:
=sum(TOTAL <Year> aggr(avg(#Boxes),PFWarehouse,Year))
KR,
Cristina
- Mark as New
- Bookmark
- Subscribe
- Mute
- Subscribe to RSS Feed
- Permalink
- Report Inappropriate Content
Cristina,
I modified your expression to fit my data model and came up with
Sum(TOTAL <Year> aggr(avg({$<RecordType={"LOAD"}>} UnitsLoaded),Warehouse,Year))
This appears to be an average for the year for each warehouse, so I changed it to go by date
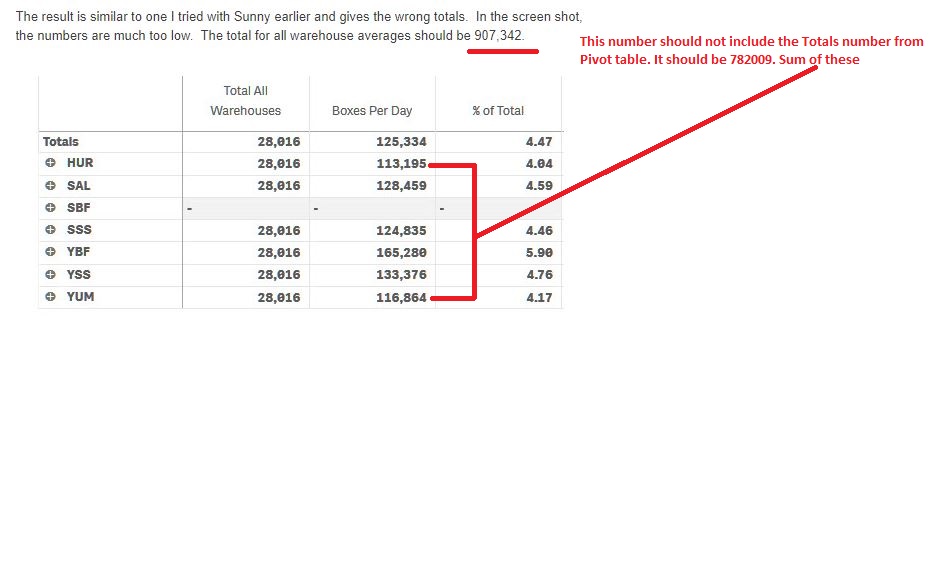
Sum(TOTAL <Year> aggr(avg({$<RecordType={"LOAD"}>} UnitsLoaded),Warehouse,Date))
The result is similar to one I tried with Sunny earlier and gives the wrong totals. In the screen shot, note that the numbers are much too low. The total for all warehouse averages should be 907,342.
- Mark as New
- Bookmark
- Subscribe
- Mute
- Subscribe to RSS Feed
- Permalink
- Report Inappropriate Content
Can you please send/attach your QVW file and maybe I can work on that directly. I'll try to reach this total of 907,342, to be sure.
Thanks!
Cristina
- Mark as New
- Bookmark
- Subscribe
- Mute
- Subscribe to RSS Feed
- Permalink
- Report Inappropriate Content
I posted a .qvf on 10/9, but here is the latest version.
Please see the "Boxes" sheet and the pivot table called "Boxes Loaded Per Day (Avg). The pivot table is a Master Item called Boxes Loaded Per Day - Pivot.
The expression for Boxes Per day is stored in a variable called vBoxesLoadedPerDay
I also created a variable for the total of all warehouses called vBoxesLoadedPerDay_AllWarehouses; this is the variable that will hold the expression for the sum of all warehouse averages. Note that PFWarehouse is used in the pivot table; this is a Master dimension that selects specific warehouses for this sheet. Esxpressions should use Warehouse as the dimension name.
Thanks for having a go at this.
- Mark as New
- Bookmark
- Subscribe
- Mute
- Subscribe to RSS Feed
- Permalink
- Report Inappropriate Content
Are you confident that the row level numbers that you get are the correct numbers you are looking to get? It seems weird that the chart sort of works the way it does.
- Mark as New
- Bookmark
- Subscribe
- Mute
- Subscribe to RSS Feed
- Permalink
- Report Inappropriate Content
Yes, I am confident that the daily average numbers are correct. If you drill down on another page, like Sales Order Metrics, and single out a date in a busy period, such as 8/9/2017, you'll see that the Shipped Qty is 139,572 for the SAL warehouse, which correlates to the averages we are seeing on the Boxes sheet.
- Mark as New
- Bookmark
- Subscribe
- Mute
- Subscribe to RSS Feed
- Permalink
- Report Inappropriate Content
I never used qvf files. So far I worked only with Qlikview files. I get this is a Qlik Sense file, right?
- Mark as New
- Bookmark
- Subscribe
- Mute
- Subscribe to RSS Feed
- Permalink
- Report Inappropriate Content
Yes, it is Qlik Sense.
- Mark as New
- Bookmark
- Subscribe
- Mute
- Subscribe to RSS Feed
- Permalink
- Report Inappropriate Content
Hi Mike,
The total you are expecting includes totals number (125,334). I think it should not include that so the number you should be expecting to see should be 782,009 or so. Assuming your numbers are correct.
Another thought to validate number is to just create a straight table with following data points
Year, Date, ReportType, Warehouse, UnitsLoaded ( These are the data points that are getting used in the formula)
Download this table in excel to confirm numbers and may be just use that table by itself in newer application to validate. Or may be use your source to just have only that data to see if your numbers are matching.
I tried doing it but numbers are no where near so not sure if there is something missing here.
Please share your thought.
BR,
Vijay
- Mark as New
- Bookmark
- Subscribe
- Mute
- Subscribe to RSS Feed
- Permalink
- Report Inappropriate Content
You are correct about the total being too high; thanks for catching that. I will take a look at your .qvf and get back to you. Thank you!