Unlock a world of possibilities! Login now and discover the exclusive benefits awaiting you.
- Qlik Community
- :
- Forums
- :
- Analytics
- :
- New to Qlik Analytics
- :
- Re: How to disable connection between filter
- Subscribe to RSS Feed
- Mark Topic as New
- Mark Topic as Read
- Float this Topic for Current User
- Bookmark
- Subscribe
- Mute
- Printer Friendly Page
- Mark as New
- Bookmark
- Subscribe
- Mute
- Subscribe to RSS Feed
- Permalink
- Report Inappropriate Content
How to disable connection between filter
Is it possible to disable the connection between to filters?
Usually when I select from one filter the corresponding answers in another filter will be shown and the answer which is not corresponding will be shown in grey like this:
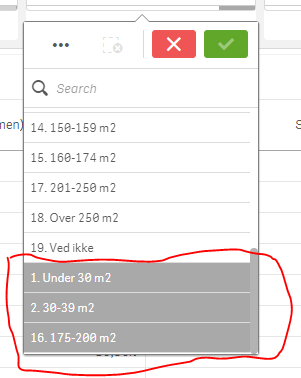
I don't want them suppressed at all.
How do I do that?
- Mark as New
- Bookmark
- Subscribe
- Mute
- Subscribe to RSS Feed
- Permalink
- Report Inappropriate Content
Hi
Are the fields in the same table?
- Mark as New
- Bookmark
- Subscribe
- Mute
- Subscribe to RSS Feed
- Permalink
- Report Inappropriate Content
You have to rebuild your data model, or use set analysis to make your measures independend of such a selection.
Tomasz
- Mark as New
- Bookmark
- Subscribe
- Mute
- Subscribe to RSS Feed
- Permalink
- Report Inappropriate Content
Thanks for you answer - but how do I do that?
- Mark as New
- Bookmark
- Subscribe
- Mute
- Subscribe to RSS Feed
- Permalink
- Report Inappropriate Content
=aggr(Only({$<YourDimension= p({1})>} YourDimension),YourDimension)
- Mark as New
- Bookmark
- Subscribe
- Mute
- Subscribe to RSS Feed
- Permalink
- Report Inappropriate Content
You can create data islands. As the name says it is a field disconnected from the others so when you select one filter the data island will not be affected.
Or you can use set analysis like this:
Imagine 2 linked fields, Country and Revenue. When i select 1 contry only 1 revenue is shown (just like in you case). To make all Revenues able to be shown i will use this set analysis in the objects that i want (obviusly i will have to use some calculation like sum, average...):
{$<Country=>}
This makes the selection of country to not affect the object.
Regards 
- Mark as New
- Bookmark
- Subscribe
- Mute
- Subscribe to RSS Feed
- Permalink
- Report Inappropriate Content
Havn't this done the trick? 

- Mark as New
- Bookmark
- Subscribe
- Mute
- Subscribe to RSS Feed
- Permalink
- Report Inappropriate Content
Hi Kenneth - I see you are new to Qlik - so some of these responses might be a bit daunting. Our Qlik Community is great, but may forget to look at the users level number and may assume the common Qlik language is understood.
You have a couple of good suggestions here - please advise if you need clarity on them.
In short what you are experiencing is part of our associative technology - which automatically displays related and unrelated values using the color scheme green, white and shades of grey - if you want to learn more you can read this post here: The Associative Difference
Now in regards to your questions:
The values that show up in gray - are not related to the current selections.
- Do you not want them to appear in gray?
- Would you rather have them removed from the list?
If you can described your use case a bit better - we can propose perhaps better ideas.
Re:
Set Analysis is an expression syntax that can restrict measures uses in visualizations to a sub-set of data that you define - there is an option to ignore any selections - so the visualization's measure displays only that measure even where someone selects values from list boxes and charts - it is very powerful expression and can be used for a number of things. There are some beginner videos on the topic here:
If you have time, I suggest you take a moment to review them.
When applicable please mark the appropriate replies as CORRECT. This will help community members and Qlik Employees know which discussions have already been addressed and have a possible known solution. Please mark threads as HELPFUL if the provided solution is helpful to the problem, but does not necessarily solve the indicated problem. You can mark multiple threads as HELPFUL if you feel additional info is useful to others.
Regards,
Mike Tarallo
Qlik
Mike Tarallo
Qlik
- Mark as New
- Bookmark
- Subscribe
- Mute
- Subscribe to RSS Feed
- Permalink
- Report Inappropriate Content
Hi Mike,
I have no problems dealing with set analysis in this case.
I have one table, But I need to use one filter for one part of the table and another filter for another part. Which means I don't want the selection from one filter to affect between the two filters.
- Mark as New
- Bookmark
- Subscribe
- Mute
- Subscribe to RSS Feed
- Permalink
- Report Inappropriate Content
DID SOMEONE FIND A SOLUTION FOR THIS ? I AM STACKING ON THE SAME PROBLEM.