Unlock a world of possibilities! Login now and discover the exclusive benefits awaiting you.
- Qlik Community
- :
- Forums
- :
- Analytics
- :
- App Development
- :
- Re: Problem summing an average in pivot table
- Subscribe to RSS Feed
- Mark Topic as New
- Mark Topic as Read
- Float this Topic for Current User
- Bookmark
- Subscribe
- Mute
- Printer Friendly Page
- Mark as New
- Bookmark
- Subscribe
- Mute
- Subscribe to RSS Feed
- Permalink
- Report Inappropriate Content
Problem summing an average in pivot table
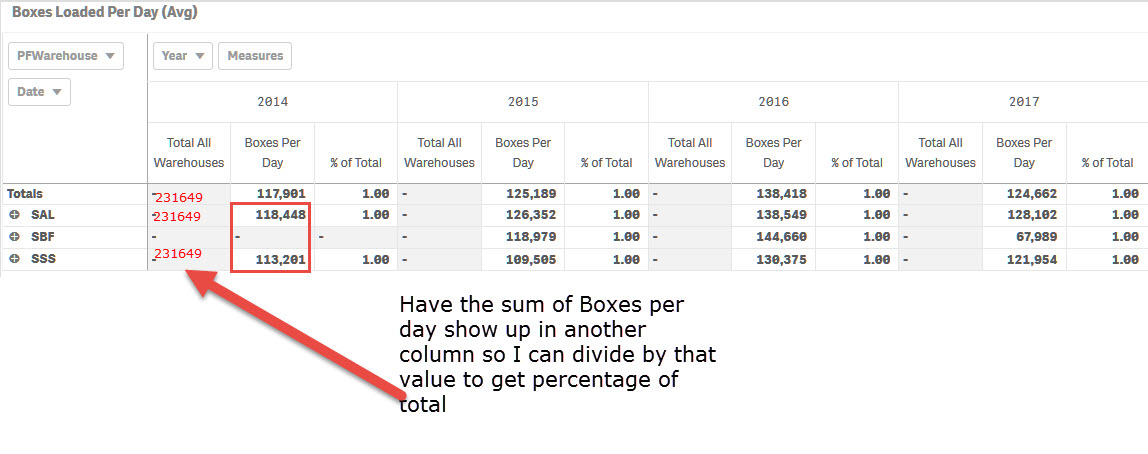
I have a pivot table with a measure that calculates the average number of boxes shipped per day by each warehouse. I'd like to get a sum of those averages by warehouse so I can then do a percentage of total calculation. The current expression to get average of boxes per day is:
Avg(Aggr(Sum({$<RecordType={"LOAD"}>} UnitsLoaded),Date))
I've tried modifying that expression in order to get the total for all warehouses but haven't been able to get any variations to work as I expect.
Avg(Aggr(Sum({$<RecordType={"LOAD"},Warehouse=>} UnitsLoaded),Date))
Avg(Aggr(Sum({1<RecordType={"LOAD"}>} UnitsLoaded),Date))
Sum(Aggr(Avg({$<RecordType={"LOAD"}>} UnitsLoaded),Date))
etc.
- Mark as New
- Bookmark
- Subscribe
- Mute
- Subscribe to RSS Feed
- Permalink
- Report Inappropriate Content
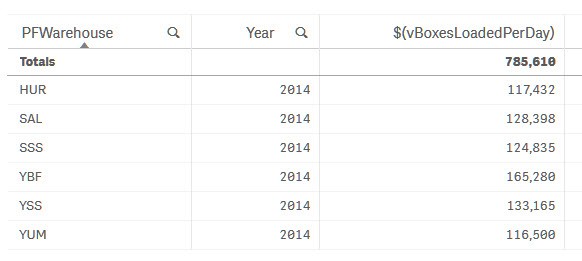
I took a look at your qvf and did not find anything other than the original formula for the average by warehouse. I suppose you just wanted confirmation of my totals? Anyway, I have verified my numbers in a straight table and I was able to do a sum total line in a straight table. I have attached a screen shot of that table showing the correct total is 785,610 for year 2014.
Thanks. 
- Mark as New
- Bookmark
- Subscribe
- Mute
- Subscribe to RSS Feed
- Permalink
- Report Inappropriate Content
Mike,
Yes, I didn't find anything else. I just wanted to use 4 or 5 data points of formula by itself. The raw data. Would it be possible for you to just provide that in an excel from your source directly.
What I tried was that I created a straight table with these data points on a new sheet. When I exported that and created new app using exported information the numbers are too low. Numbers shouldn't be that low. Hence we should just try the pivot table in a new app where only these data points are available
BR
- Mark as New
- Bookmark
- Subscribe
- Mute
- Subscribe to RSS Feed
- Permalink
- Report Inappropriate Content
Can you download the qvf I provided in the discussion earlier? There's one that I posted within the last 24 hours.
- Mark as New
- Bookmark
- Subscribe
- Mute
- Subscribe to RSS Feed
- Permalink
- Report Inappropriate Content
Hi Mike,
I wanted raw data to try in a new dashboard, and may be in qlikview also. I had already downloaded your newer file but it is hard to extract data from it.
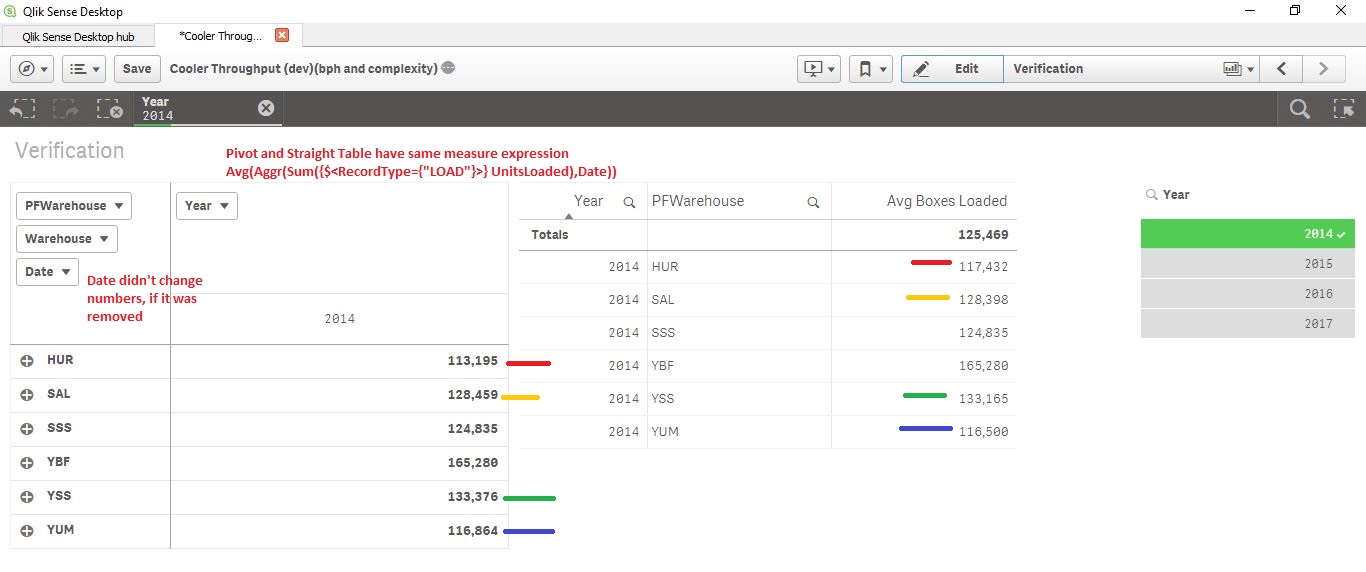
Anyway I have created a pivot table and a straight table in your file on sheet name verification.
I'm using the expression directly for Avg Boxes Loaded
Avg(Aggr(Sum({$<RecordType={"LOAD"}>} UnitsLoaded),Date))
Not sure why there are differences in some numbers as can be seen from screen shot below.
- Mark as New
- Bookmark
- Subscribe
- Mute
- Subscribe to RSS Feed
- Permalink
- Report Inappropriate Content
Try
Avg(Aggr(Sum({$<RecordType={"LOAD"}>} UnitsLoaded),Date,PFWarehouse))
- Mark as New
- Bookmark
- Subscribe
- Mute
- Subscribe to RSS Feed
- Permalink
- Report Inappropriate Content
Thanks for the suggestion but this has been tried already and does not work.
- Mark as New
- Bookmark
- Subscribe
- Mute
- Subscribe to RSS Feed
- Permalink
- Report Inappropriate Content
Those differences may be due to not having the full dataset loaded, but that's just a guess. Perhaps I can output the main CoolerOut table to a QVD for you? You might also need the Calendar table but I don't think you'll need Receipts, ItemDescriptions, etc Let me know if you want the QVDs and I can attach them.
- Mark as New
- Bookmark
- Subscribe
- Mute
- Subscribe to RSS Feed
- Permalink
- Report Inappropriate Content
Hi Mike,
If it is ok for you to provide QVD then that is okay, otherwise excel, txt is fine as well. No need of other information, only date, reporttype, unitsloaded, warehouse will be sufficient.
BR,
Vijay
- Mark as New
- Bookmark
- Subscribe
- Mute
- Subscribe to RSS Feed
- Permalink
- Report Inappropriate Content
Here's an Excel spreadsheet that contains pertinent data; four periods from one year. Hope that helps.
- Mark as New
- Bookmark
- Subscribe
- Mute
- Subscribe to RSS Feed
- Permalink
- Report Inappropriate Content
Hi Mike,
In the attached excel file there is no UnitLoaded field. That is fine. I'm using ShipQty instead. I'm unable to get the formula working.
Have you been successfully calculate it in Excel? If so, would you be able to share it? The excel formula may provide some new thoughts/directions as we have exhausted possible ideas. It would be nice to have it for a year, say 2014. The raw data, the sum by day, aggregated by, etc. etc. to arrive at final expected output along with final values
Good Luck.
BR,
Vijay