Unlock a world of possibilities! Login now and discover the exclusive benefits awaiting you.
- Qlik Community
- :
- Forums
- :
- Analytics
- :
- New to Qlik Analytics
- :
- Limiting Dashboard Rows.
- Subscribe to RSS Feed
- Mark Topic as New
- Mark Topic as Read
- Float this Topic for Current User
- Bookmark
- Subscribe
- Mute
- Printer Friendly Page
- Mark as New
- Bookmark
- Subscribe
- Mute
- Subscribe to RSS Feed
- Permalink
- Report Inappropriate Content
Limiting Dashboard Rows.
Hi All,
I have a dashboard which has one dimension and three measures.
| Firm | Open Cases | Closed Cases | Reassigned Cases |
Here Firm is a dimension while the others are measures. Now in this dashboard I need to show the rows only for the Firms where Open Cases and Closed Cases both are greater than 0 irrespective of the value in Reassigned Cases column. If for a firm Open Cases=0 and Closed Cases=0, the row for that Firm will not be displayed even if Reassigned Cases>0.
How can this be achieved in Qlik Sense?
Thanks,
Rajarshi Guin
- Mark as New
- Bookmark
- Subscribe
- Mute
- Subscribe to RSS Feed
- Permalink
- Report Inappropriate Content
If you don't need to see all of the data in the app you could filter out the firms with Open and Closed cases = 0 in your script and then the only data in your app would be firms that have cases and you can just display them all.
- Mark as New
- Bookmark
- Subscribe
- Mute
- Subscribe to RSS Feed
- Permalink
- Report Inappropriate Content
Hi Mark,
Those columns are calculated in runtime based on the dates the user selects as filters. So, they cannot be removed in the script.
- Mark as New
- Bookmark
- Subscribe
- Mute
- Subscribe to RSS Feed
- Permalink
- Report Inappropriate Content
Maybe as expressions:
Expression 1 : expression for Open Cases
Expression 2 : expression for closed cases
Expression 3, if(expression for open cases=0 and expression for closed cases =0, 0, expression for reassigned cases
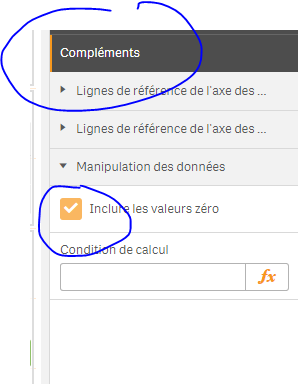
and then, under, adds-on, uncheck: show zero values:
- Mark as New
- Bookmark
- Subscribe
- Mute
- Subscribe to RSS Feed
- Permalink
- Report Inappropriate Content
you can use the below in your chart object:
dimension:
Aggr( if( Count( Open_Cases ) > 0 and Count( Closed_Cases) > 0, Firm, null() ), Firm)
and untick "Include null values".
- Mark as New
- Bookmark
- Subscribe
- Mute
- Subscribe to RSS Feed
- Permalink
- Report Inappropriate Content
Hi Omar,
This has solved the issue. Thanks.