Unlock a world of possibilities! Login now and discover the exclusive benefits awaiting you.
- Qlik Community
- :
- Forums
- :
- Analytics
- :
- New to Qlik Analytics
- :
- Re: How could create a Group Median line in the Ch...
- Subscribe to RSS Feed
- Mark Topic as New
- Mark Topic as Read
- Float this Topic for Current User
- Bookmark
- Subscribe
- Mute
- Printer Friendly Page
- Mark as New
- Bookmark
- Subscribe
- Mute
- Subscribe to RSS Feed
- Permalink
- Report Inappropriate Content
How could create a Group Median line in the Chart
Hi,
I have a group have 4 subgroup.
I create line chart to have individual group line (sum(Sales) per day)draw out
but I want to have a Group reference Line (Median(all 4 subgroup sale)per day) in the Same graph.
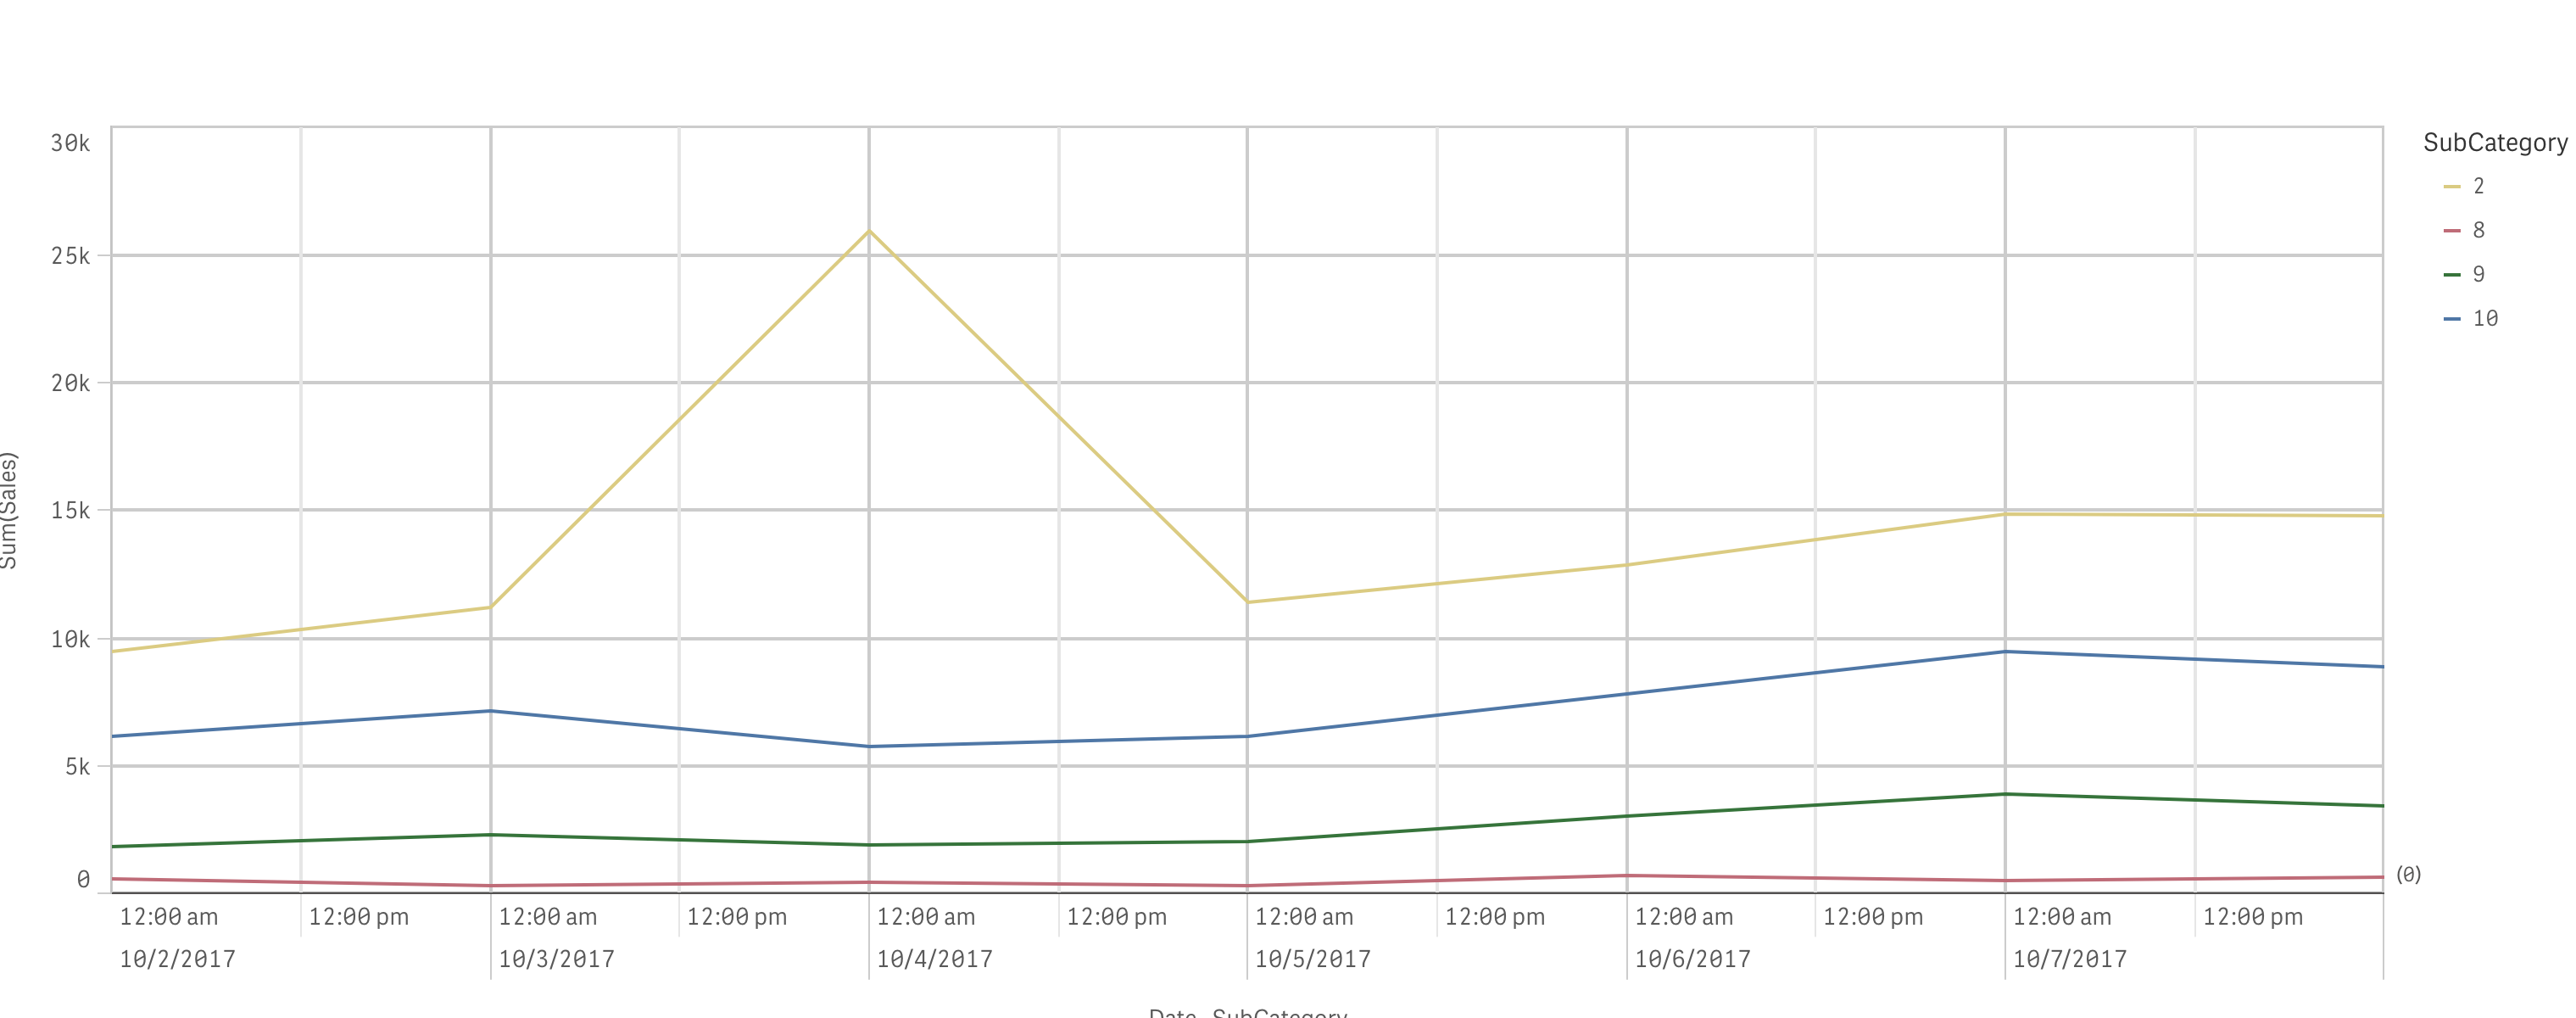
Any suggestion how could I achieve that?
Here is the qvf file in the attachment. Thank you so much!
Regards,
Celine !
- Tags:
- agg
- group
- line chart
- « Previous Replies
-
- 1
- 2
- Next Replies »
Accepted Solutions
- Mark as New
- Bookmark
- Subscribe
- Mute
- Subscribe to RSS Feed
- Permalink
- Report Inappropriate Content
Open this link and I have attached the qvf (twice now)
Re: How could create a Group Median line in the Chart
- Mark as New
- Bookmark
- Subscribe
- Mute
- Subscribe to RSS Feed
- Permalink
- Report Inappropriate Content
Is this line going to be a static line? or is that going to change each day?
- Mark as New
- Bookmark
- Subscribe
- Mute
- Subscribe to RSS Feed
- Permalink
- Report Inappropriate Content
Now it is static.
But if possible, this will be refresh weekly
Could I have both solutions?
Thank you!
- Mark as New
- Bookmark
- Subscribe
- Mute
- Subscribe to RSS Feed
- Permalink
- Report Inappropriate Content
What I meant to ask is that you need Median for each day or Median across all dates and subcategories?
- Mark as New
- Bookmark
- Subscribe
- Mute
- Subscribe to RSS Feed
- Permalink
- Report Inappropriate Content
Sorry. did not understand correctly
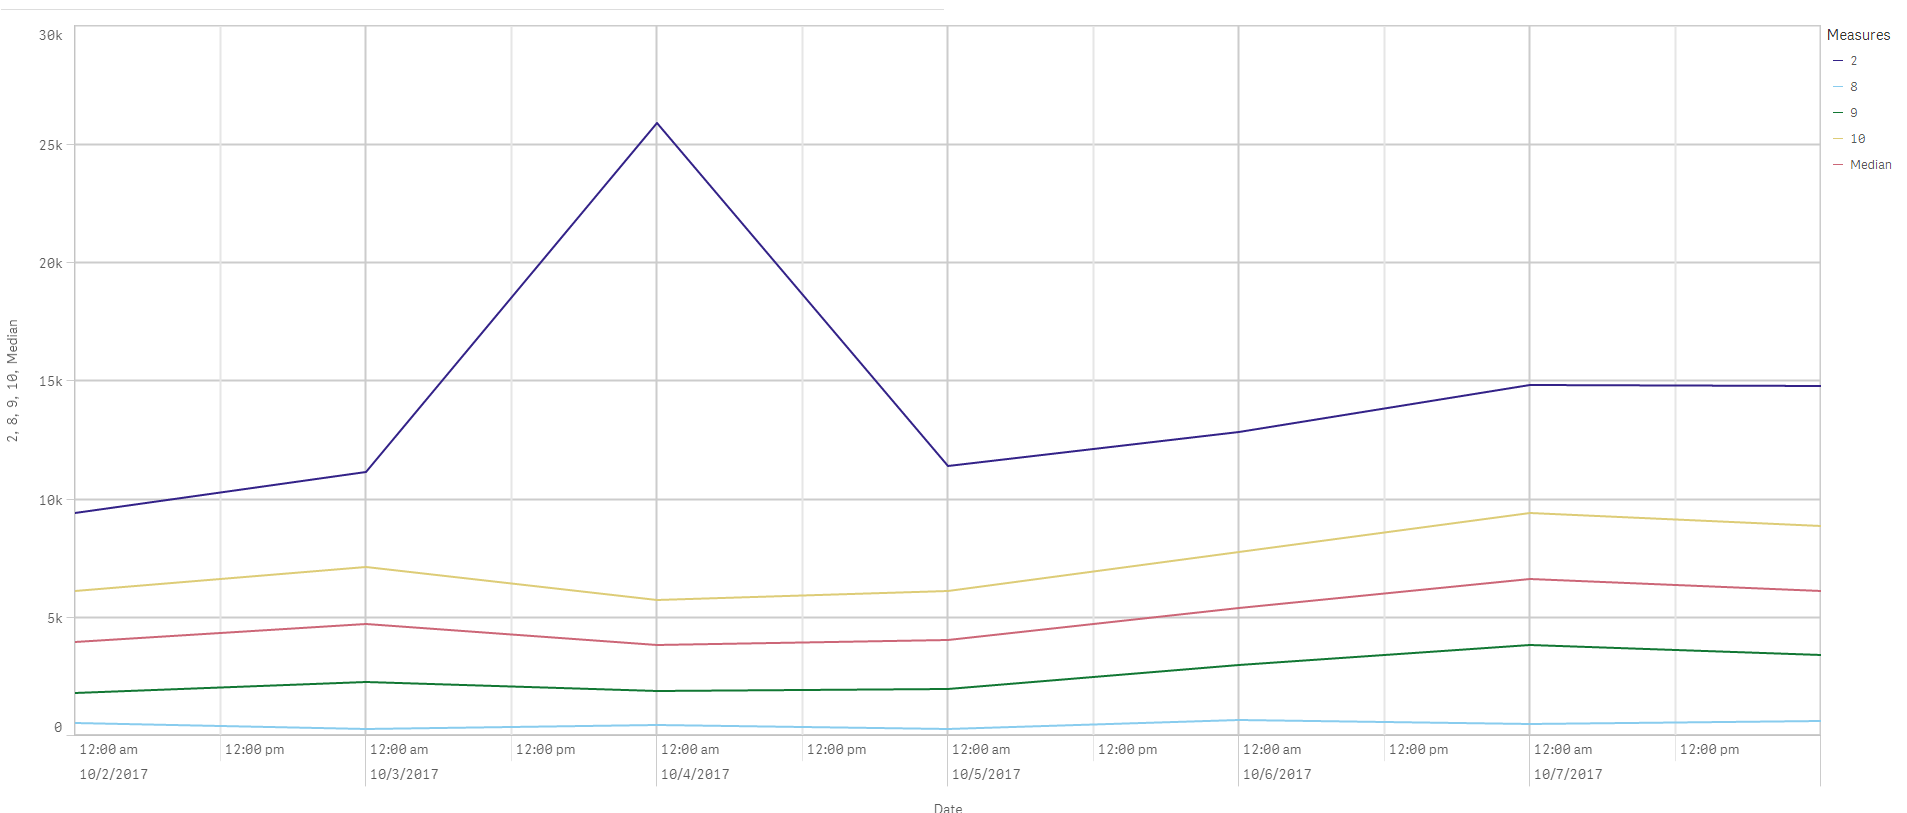
I want a line (not the straight reference line) have 7 points. and each point represents 1 day for 4 subcategoris' Median
- Mark as New
- Bookmark
- Subscribe
- Mute
- Subscribe to RSS Feed
- Permalink
- Report Inappropriate Content
May be create multiple expressions with single dimension?
- Mark as New
- Bookmark
- Subscribe
- Mute
- Subscribe to RSS Feed
- Permalink
- Report Inappropriate Content
Sure. this is what i want. How did you do that?
could i have the qvf with function ?
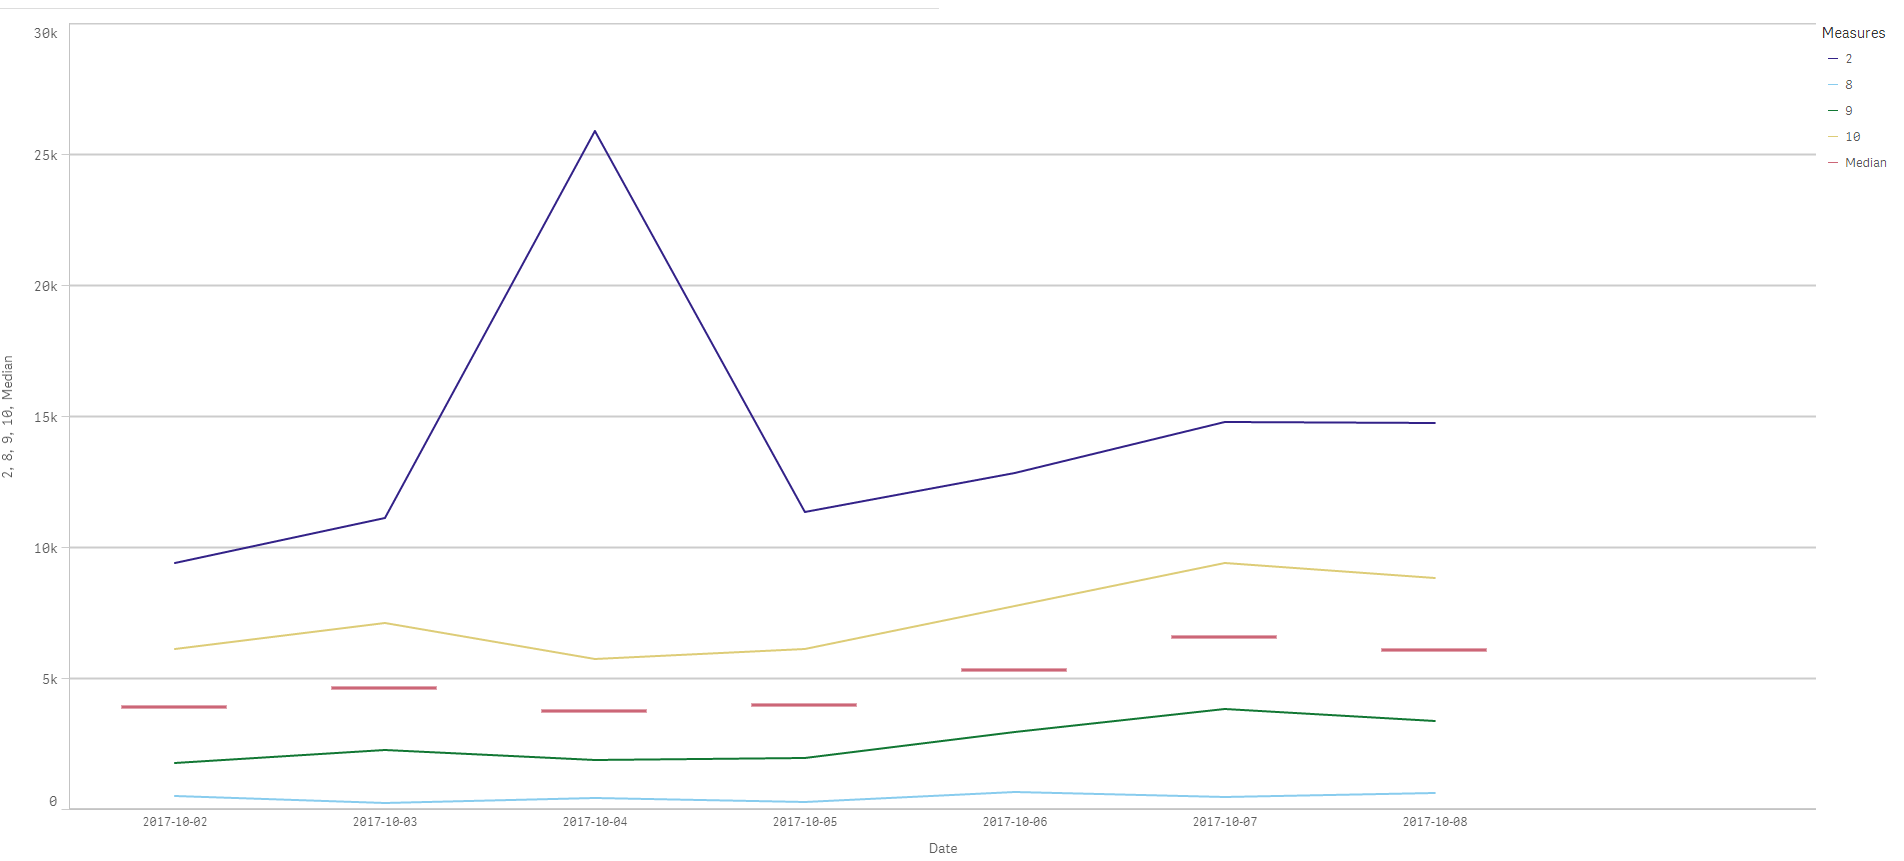
and any chance we can make the Media line --Boarder? or Darker? or change the line shape?. to distinguish from the individual one? (any One methord would be nice)
- Mark as New
- Bookmark
- Subscribe
- Mute
- Subscribe to RSS Feed
- Permalink
- Report Inappropriate Content
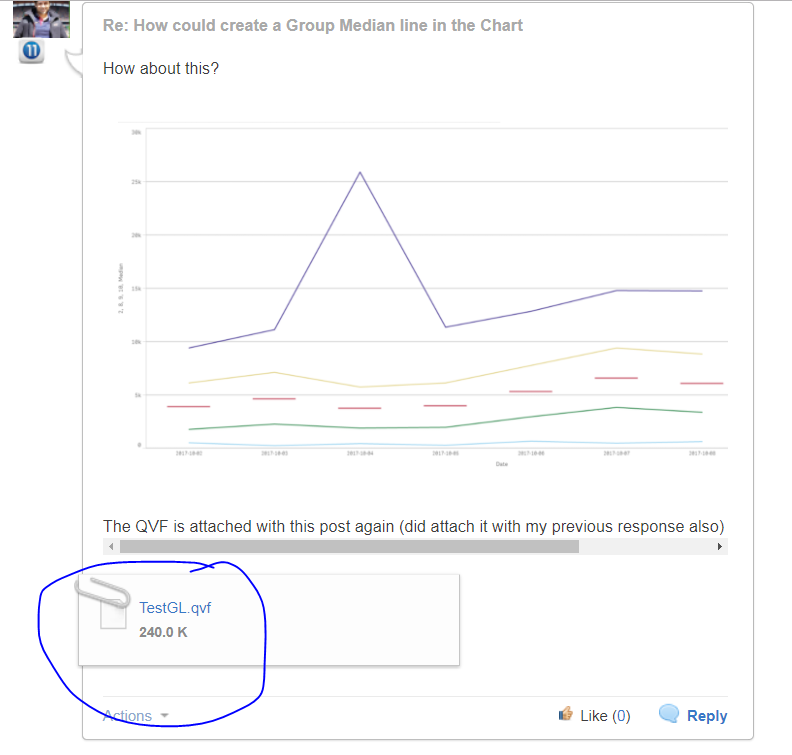
How about this?
The QVF is attached with this post again (did attach it with my previous response also)
- Mark as New
- Bookmark
- Subscribe
- Mute
- Subscribe to RSS Feed
- Permalink
- Report Inappropriate Content
Have used line for marker, but you can chose any other symbol also
- Mark as New
- Bookmark
- Subscribe
- Mute
- Subscribe to RSS Feed
- Permalink
- Report Inappropriate Content
Cool. But how did you do that?
what things i need to do? could you attach the qvf please? or teach me how to do that?
Thank you!
- « Previous Replies
-
- 1
- 2
- Next Replies »