Unlock a world of possibilities! Login now and discover the exclusive benefits awaiting you.
- Qlik Community
- :
- Forums
- :
- Analytics
- :
- New to Qlik Analytics
- :
- Re: How could create a Group Median line in the Ch...
- Subscribe to RSS Feed
- Mark Topic as New
- Mark Topic as Read
- Float this Topic for Current User
- Bookmark
- Subscribe
- Mute
- Printer Friendly Page
- Mark as New
- Bookmark
- Subscribe
- Mute
- Subscribe to RSS Feed
- Permalink
- Report Inappropriate Content
How could create a Group Median line in the Chart
Hi,
I have a group have 4 subgroup.
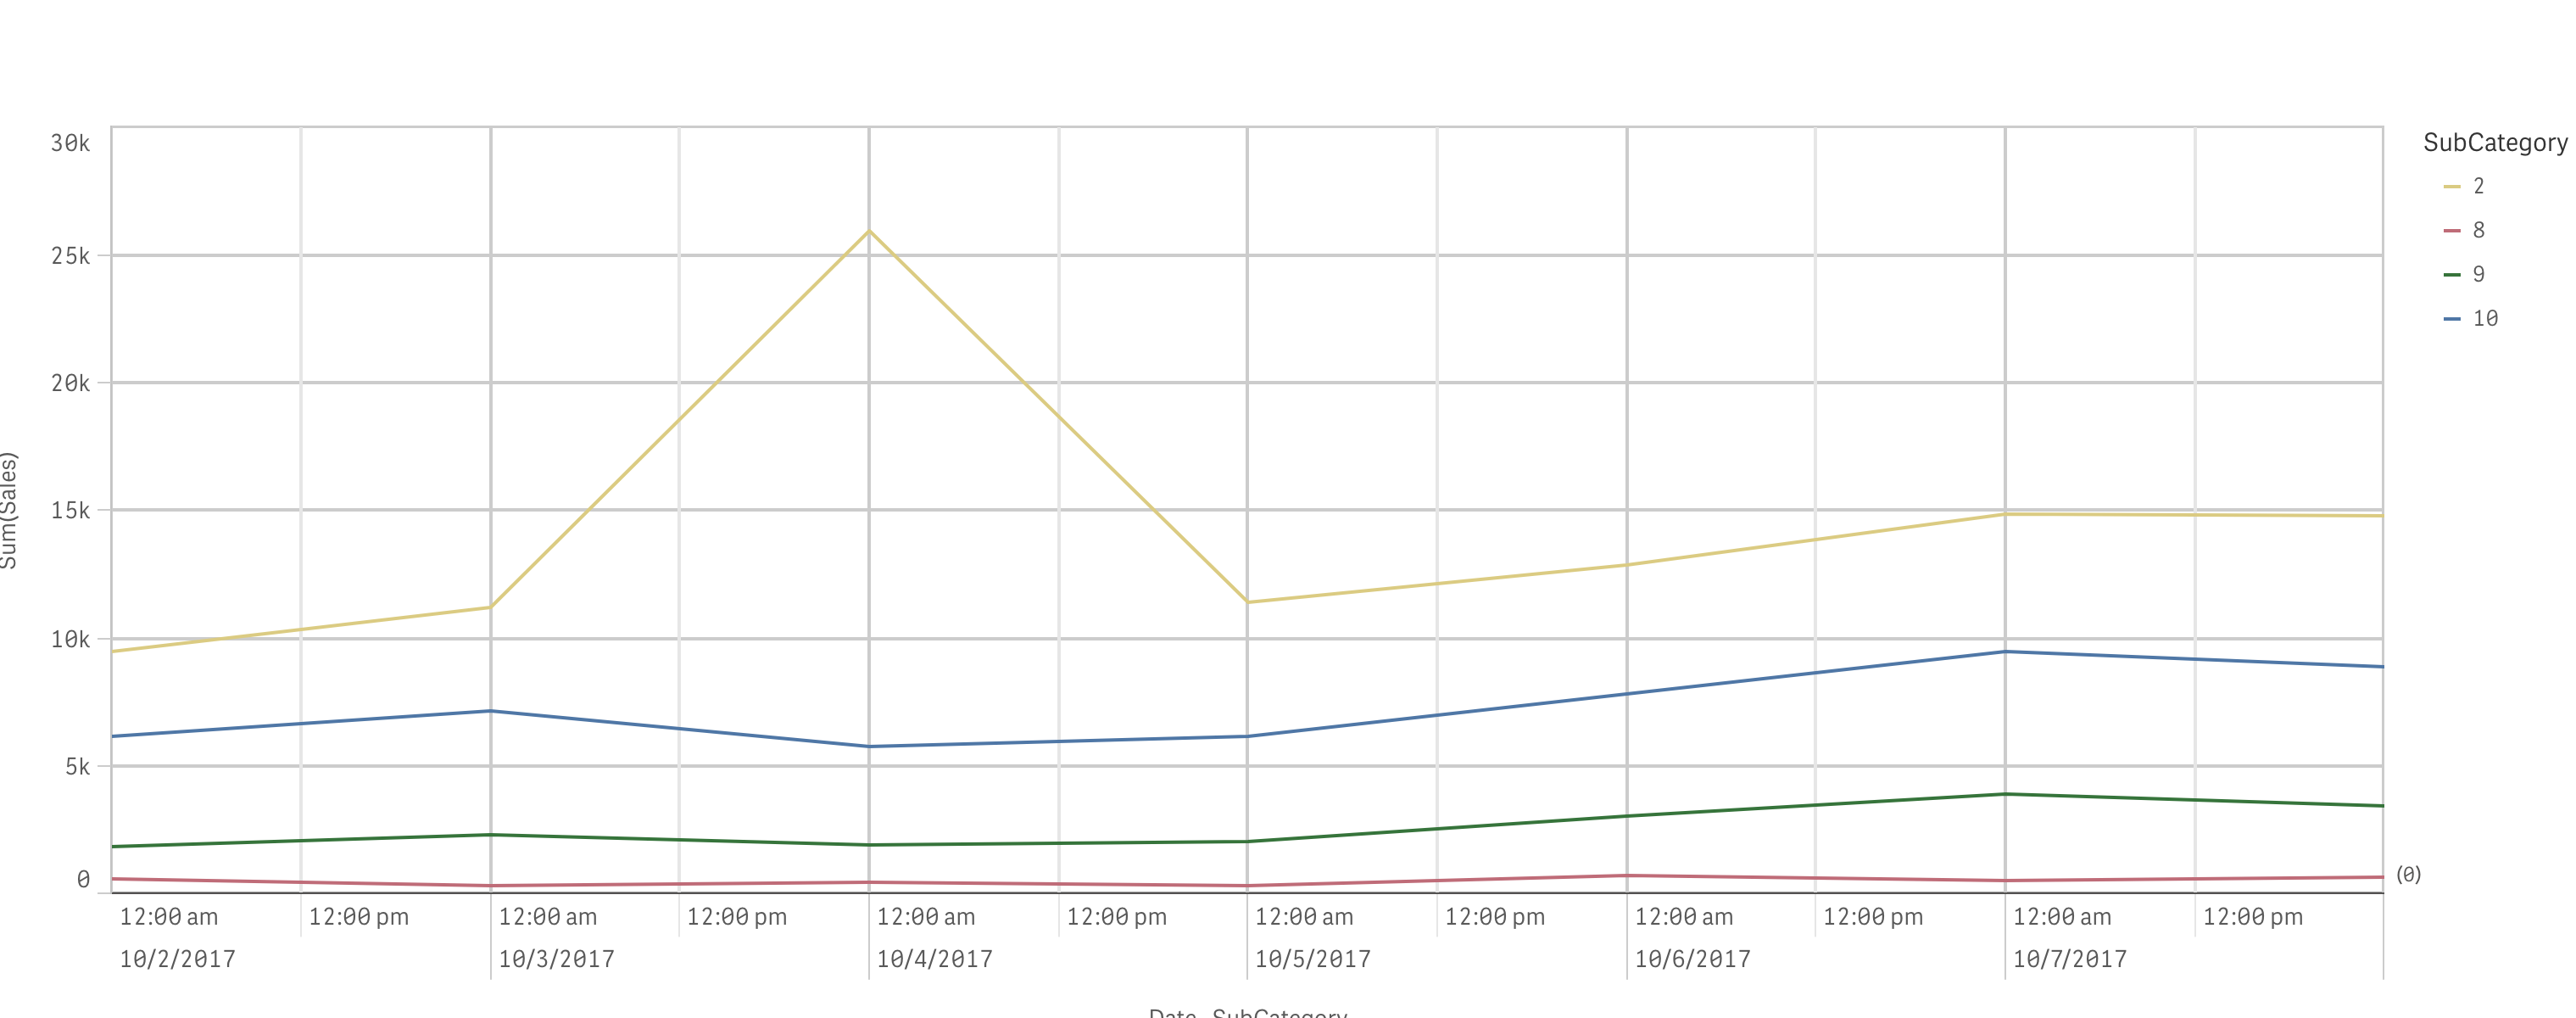
I create line chart to have individual group line (sum(Sales) per day)draw out
but I want to have a Group reference Line (Median(all 4 subgroup sale)per day) in the Same graph.
Any suggestion how could I achieve that?
Here is the qvf file in the attachment. Thank you so much!
Regards,
Celine !
- Tags:
- agg
- group
- line chart
- « Previous Replies
-
- 1
- 2
- Next Replies »
- Mark as New
- Bookmark
- Subscribe
- Mute
- Subscribe to RSS Feed
- Permalink
- Report Inappropriate Content
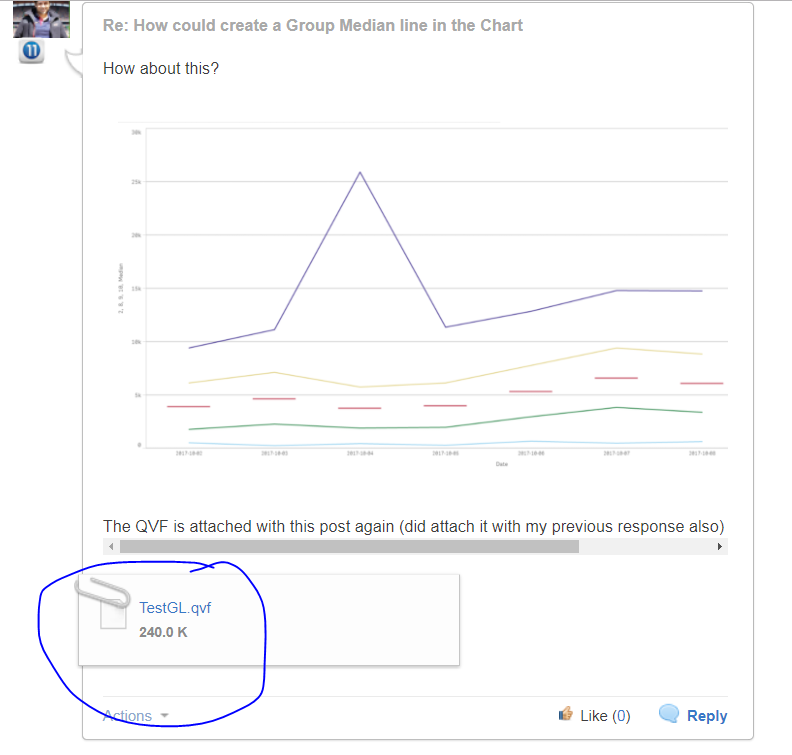
Open this link and I have attached the qvf (twice now)
Re: How could create a Group Median line in the Chart
- Mark as New
- Bookmark
- Subscribe
- Mute
- Subscribe to RSS Feed
- Permalink
- Report Inappropriate Content
Thank you so much. was still finding out how to use this website
- Mark as New
- Bookmark
- Subscribe
- Mute
- Subscribe to RSS Feed
- Permalink
- Report Inappropriate Content
Sorry, saw the file, which means.
we can not combine the 'SubCategory' in the dimention and then add the 'Median' in the Measure
we have to add individually. Each line?
If I need to check the other Category and or 'Drill down', which means, use Segment as (Sub sub category) for subCategory will not fit. Need to create graph again and using 'Set analysis'
one thing here what the * means in the function.
Sum({<SubCategory *= {2}>}Sales)
Saw the video about how to use the set analysis but the expression seems a little bit different. Thank you!
- Mark as New
- Bookmark
- Subscribe
- Mute
- Subscribe to RSS Feed
- Permalink
- Report Inappropriate Content
This expression will always show SubCategory regardless of any selection in SubCategory field
Sum({<SubCategory = {2}>}Sales)
This expression will show intersection of your current selection and the set modifier... so if you have not selected SubCategory = 2, the expression will turn to 0
Sum({<SubCategory *= {2}>}Sales)
Read more about this here:
- « Previous Replies
-
- 1
- 2
- Next Replies »