Unlock a world of possibilities! Login now and discover the exclusive benefits awaiting you.
- Qlik Community
- :
- Forums
- :
- Analytics
- :
- App Development
- :
- Re: Problem summing an average in pivot table
- Subscribe to RSS Feed
- Mark Topic as New
- Mark Topic as Read
- Float this Topic for Current User
- Bookmark
- Subscribe
- Mute
- Printer Friendly Page
- Mark as New
- Bookmark
- Subscribe
- Mute
- Subscribe to RSS Feed
- Permalink
- Report Inappropriate Content
Problem summing an average in pivot table
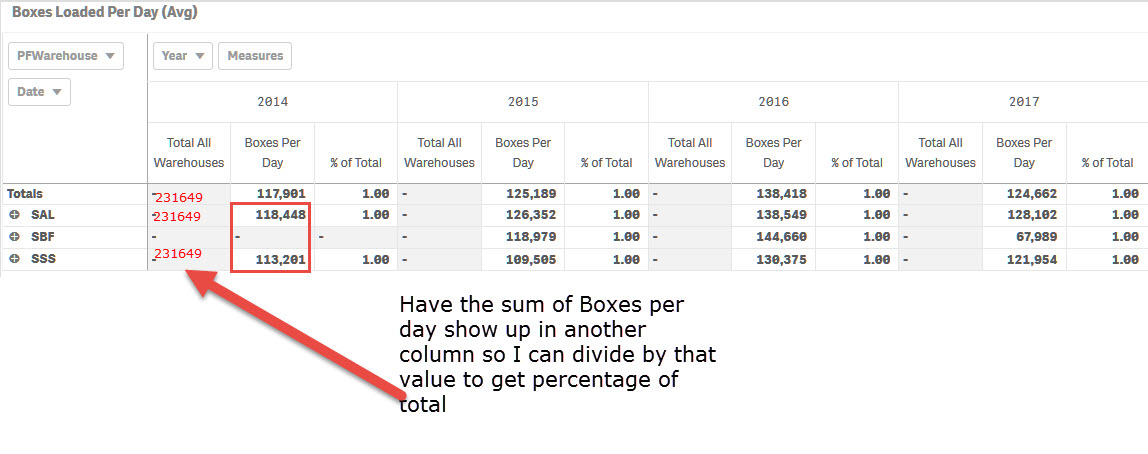
I have a pivot table with a measure that calculates the average number of boxes shipped per day by each warehouse. I'd like to get a sum of those averages by warehouse so I can then do a percentage of total calculation. The current expression to get average of boxes per day is:
Avg(Aggr(Sum({$<RecordType={"LOAD"}>} UnitsLoaded),Date))
I've tried modifying that expression in order to get the total for all warehouses but haven't been able to get any variations to work as I expect.
Avg(Aggr(Sum({$<RecordType={"LOAD"},Warehouse=>} UnitsLoaded),Date))
Avg(Aggr(Sum({1<RecordType={"LOAD"}>} UnitsLoaded),Date))
Sum(Aggr(Avg({$<RecordType={"LOAD"}>} UnitsLoaded),Date))
etc.
- Mark as New
- Bookmark
- Subscribe
- Mute
- Subscribe to RSS Feed
- Permalink
- Report Inappropriate Content
Hi Vijay.
ShipQty is the same as UnitsLoaded (it's just a Sum(UnitsLoaded) in the table that I exported to the Excel file). I couldn't send a full year of data due to the row limitation in Excel. I'll look at creating a QVD instead so you can get all the data needed for this calculation to work.
- Mark as New
- Bookmark
- Subscribe
- Mute
- Subscribe to RSS Feed
- Permalink
- Report Inappropriate Content
Hi Mike,
QVD is not required. I was just trying to see if you were to do that calculation in an Excel Worksheet, how you would have done that. Understanding that would have allowed to come up with logic in Qlik.
BR,
Vijay
- Mark as New
- Bookmark
- Subscribe
- Mute
- Subscribe to RSS Feed
- Permalink
- Report Inappropriate Content
Here's just 2016 data in a QVD and a sample application QVF with a straight table Notice in the straight table I can get a daily average by warehouse, and get a sum of those averages in the Totals line. I'd like to be able to get that same total in a pivot table too.
Thanks,
Mike
- Mark as New
- Bookmark
- Subscribe
- Mute
- Subscribe to RSS Feed
- Permalink
- Report Inappropriate Content
I have not attempted to do the same thing in an Excel workbook.
- Mark as New
- Bookmark
- Subscribe
- Mute
- Subscribe to RSS Feed
- Permalink
- Report Inappropriate Content
Hi Mike,
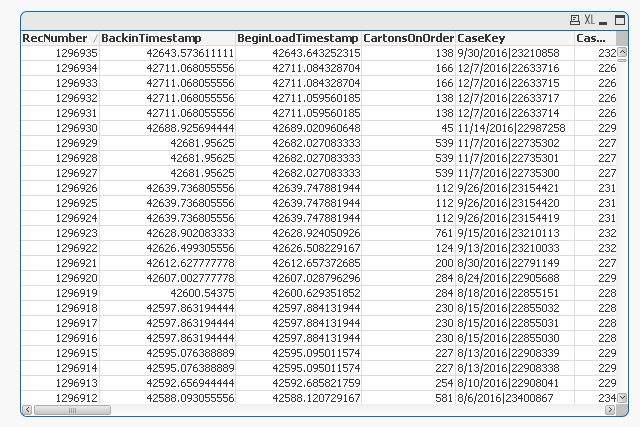
Using 2016 QVD I found that there are duplicate records
I used following script
NoConcatenate
CoolerOut2016:
LOAD SalesOrder,
OrdNumKey,
RecordType,
CaseNumber,
CaseKey,
OrderKey,
Warehouse,
WageLocationKey,
OrderType,
ReceiptType,
ItemNumber,
ShipToNumber,
ShipToCustomer,
SoldToNumber,
SoldToCustomer,
GroupNumber,
GroupCustomer,
PickDate,
UnitsLoaded,
PickFlag,
ItemOrderPallets,
WageWHUnitsLoaded,
CheckinHour,
Hour,
ShipHour,
MinutesToLoad,
HoursToLoad,
UnitsPerHr,
CheckinTimestamp,
BackinTimestamp,
BeginLoadTimestamp,
Date,
DayOfWeek,
LoadDateHour,
EndLoadTimestamp,
ShipTimestamp,
TruckNumber,
ItemsOnOrder,
StagedItemsOnOrder,
CartonsOnOrder,
PalletsOnOrder,
AutoNumber(RowNo()) as RecNumber
FROM
CoolerOut2016.qvd
(qvd);
NoConcatenate
SAL_Warehouse_Info:
LOAD Warehouse,
Date as GroupDate,
Sum(UnitsLoaded) as UnitsLoadedByDate,
Count(RecNumber) as RecCountByDate
Resident CoolerOut2016
Group By Warehouse, Date
Order By Warehouse, Date;
AutoNumber(RowNo()) as RecNumber shows 1,296,935 records
If I don't use this field in the table and export data (I exported using selective warehouse to limit number of rows won't exceed Excel limit) then it gives me following. I've attached excels for your reference.
| Warehouse | QVD Rows | QlikTable | Diff | |
| HOL | 38483 | vs | 38405 | 78 |
| HUR | 68422 | vs | 68279 | 143 |
| OXN | 51601 | vs | 51486 | 115 |
| SAL | 634141 | vs | 631592 | 2549 |
| SBF | 55554 | vs | 55313 | 241 |
| SSS | 33318 | vs | 33093 | 225 |
| VBF | 9719 | vs | 9675 | 44 |
| YSS | 19926 | vs | 19809 | 117 |
| YUM | 385771 | vs | 384206 | 1565 |
| 1296935 | 1291858 | 5077 |
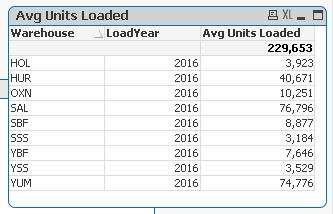
For warehouse SAL the UnitsLoaded Sum is 22,808,466, there are 297 different dates contributing to that sum. The Average comes to 76,796
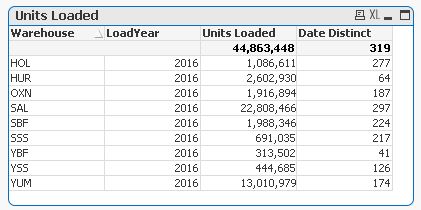
I'm not sure why Qlik shows 1138 without any selection in Qlik. If I make selection of SAL then it shows 76,796 the formula I'm using is following
Avg(Aggr(Sum({<RecordType={'Load'}>} UnitsLoaded), Date))
Please refer to following screenshots
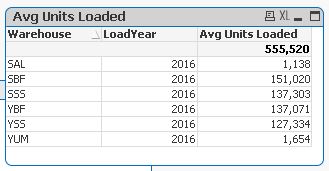

Can't understand this behavior and don't know what the reasoning for this can be
Also why some of the warehouses are not showing up as can be seen in the screen shot above
Can you please verify numbers, also come up with formulas in excel to get the numbers you have to arrive at. That will help in strategy we should take to come up with solution.
- Mark as New
- Bookmark
- Subscribe
- Mute
- Subscribe to RSS Feed
- Permalink
- Report Inappropriate Content
This is a typical problem of Grain Mis-match
Pitfalls of the Aggr function
Try this expression and see what you get (still might not be perfect just because averages Average – Which average? are sort of annoying)
Avg(Aggr(Sum({<RecordType={'Load'}>} UnitsLoaded), Date, Warehouse))
- Mark as New
- Bookmark
- Subscribe
- Mute
- Subscribe to RSS Feed
- Permalink
- Report Inappropriate Content
attachments
- Mark as New
- Bookmark
- Subscribe
- Mute
- Subscribe to RSS Feed
- Permalink
- Report Inappropriate Content
Yes, that changed
- Mark as New
- Bookmark
- Subscribe
- Mute
- Subscribe to RSS Feed
- Permalink
- Report Inappropriate Content
Sunny,
Now how to get total 229,653 across all warehouses as second expression. That's sort of Mike's need, may not be exact but similar.
- Mark as New
- Bookmark
- Subscribe
- Mute
- Subscribe to RSS Feed
- Permalink
- Report Inappropriate Content
Can you post the qvw instead of excel or is it too big?