Unlock a world of possibilities! Login now and discover the exclusive benefits awaiting you.
- Qlik Community
- :
- Forums
- :
- Analytics
- :
- App Development
- :
- Re: Problem summing an average in pivot table
- Subscribe to RSS Feed
- Mark Topic as New
- Mark Topic as Read
- Float this Topic for Current User
- Bookmark
- Subscribe
- Mute
- Printer Friendly Page
- Mark as New
- Bookmark
- Subscribe
- Mute
- Subscribe to RSS Feed
- Permalink
- Report Inappropriate Content
Problem summing an average in pivot table
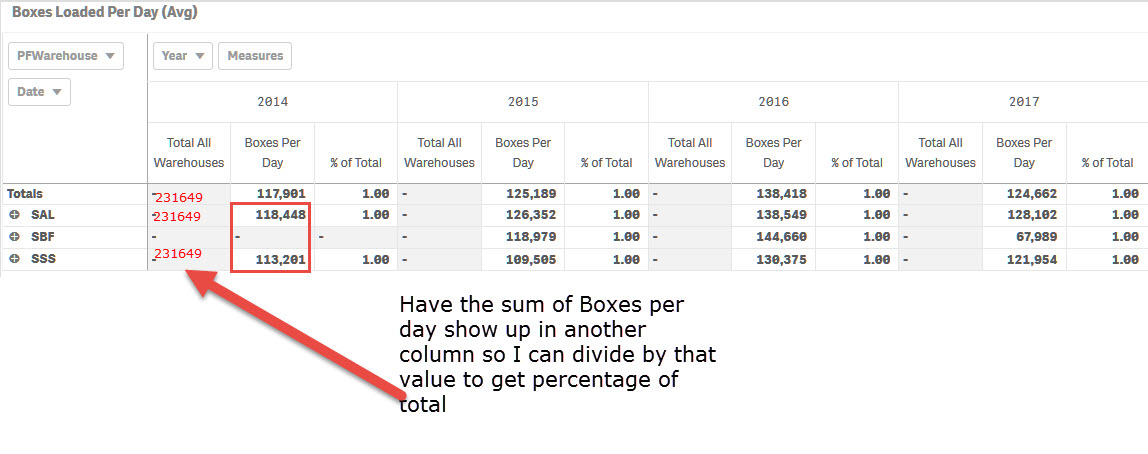
I have a pivot table with a measure that calculates the average number of boxes shipped per day by each warehouse. I'd like to get a sum of those averages by warehouse so I can then do a percentage of total calculation. The current expression to get average of boxes per day is:
Avg(Aggr(Sum({$<RecordType={"LOAD"}>} UnitsLoaded),Date))
I've tried modifying that expression in order to get the total for all warehouses but haven't been able to get any variations to work as I expect.
Avg(Aggr(Sum({$<RecordType={"LOAD"},Warehouse=>} UnitsLoaded),Date))
Avg(Aggr(Sum({1<RecordType={"LOAD"}>} UnitsLoaded),Date))
Sum(Aggr(Avg({$<RecordType={"LOAD"}>} UnitsLoaded),Date))
etc.
- Mark as New
- Bookmark
- Subscribe
- Mute
- Subscribe to RSS Feed
- Permalink
- Report Inappropriate Content
Second attachment
- Mark as New
- Bookmark
- Subscribe
- Mute
- Subscribe to RSS Feed
- Permalink
- Report Inappropriate Content
I'm attaching it. Due to slow connection it will take little time. It is 40+ MB. It will show up in another message once upload is complete.
- Mark as New
- Bookmark
- Subscribe
- Mute
- Subscribe to RSS Feed
- Permalink
- Report Inappropriate Content
Hi Sunny,
It is big but not as big as the excels. It is around 40+MB. Here it is.
- Mark as New
- Bookmark
- Subscribe
- Mute
- Subscribe to RSS Feed
- Permalink
- Report Inappropriate Content
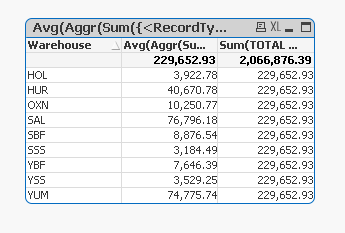
For the sample attached... this would work
Sum(TOTAL Aggr(Avg(Aggr(Sum({<RecordType={'Load'}>} UnitsLoaded), Date, Warehouse)), Warehouse))
But, because there is a grain mis-match in the actual calculation, I have not been able to use this expression... as soon as I change to this kind of expression, the row-wise value change.
Not posting the qvw as it is huge... I just created the chart using these
Dimension
Warehouse
Expressions
Avg(Aggr(Sum({<RecordType={'Load'}>} UnitsLoaded), Date, Warehouse))
Sum(TOTAL Aggr(Avg(Aggr(Sum({<RecordType={'Load'}>} UnitsLoaded), Date, Warehouse)), Warehouse))
- Mark as New
- Bookmark
- Subscribe
- Mute
- Subscribe to RSS Feed
- Permalink
- Report Inappropriate Content
Hi Sunny,
I think that should help Mike. Only thing I'm not sure about is that if it will work for him as we did it in QlikView and he is using QlikSense. I think it should be fine.

- Mark as New
- Bookmark
- Subscribe
- Mute
- Subscribe to RSS Feed
- Permalink
- Report Inappropriate Content
Expression will make be no different in QlikView or QlikSense and should work the same way
- Mark as New
- Bookmark
- Subscribe
- Mute
- Subscribe to RSS Feed
- Permalink
- Report Inappropriate Content
Thank you for doing the deep dive on this; I will comb through everything and let you know the results. I'm surprised at the duplicate records since I used a SELECT DISTINCT in the original SQL that was used to create the QVD. Nice collaboration between you and Sunny and I appreciate it very much.
- Mark as New
- Bookmark
- Subscribe
- Mute
- Subscribe to RSS Feed
- Permalink
- Report Inappropriate Content
Sunny, thanks for collaborating with Vijay on this deep dive; I really appreciate it. After reading about the pitfalls of Aggr I'm unclear as to how this would be a grain mismatch. The expressions we've been using include Date, but don't reference Year, so the avg by Date should work. Could there be a grain mismatch between Warehouse and PFWarehouse? Since I only want results for specific warehouses, I'm using a Master dimension called PFWarehouse in my charts, which is defined as:
=If(Match(Warehouse,'HUR','SAL','SSS','SBF','YUM','YBF','YSS'),Warehouse,Null())
I'm then excluding Nulls from my charts and only showing the results with numbers. However, in my expressions I am using Warehouse. Perhaps this is causing bad behavior?
- Mark as New
- Bookmark
- Subscribe
- Mute
- Subscribe to RSS Feed
- Permalink
- Report Inappropriate Content
By the way, it is possible for one CaseNumber to have multiple records, due to multiple item codes can be on each pallet. So, perhaps they are not true duplicate records that you're looking at?
- Mark as New
- Bookmark
- Subscribe
- Mute
- Subscribe to RSS Feed
- Permalink
- Report Inappropriate Content
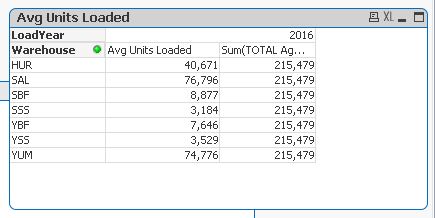
The grain mis-match is due to Warehouse not added within the Aggr() function, but it is part of your chart. That is the reason I asked you if you are confident that your row level numbers are correct or not... because as soon as I added Warehouse to the Aggr(), the row level number changed... but since you were so confident with the row level numbers that I was not able to make any further suggestions. But see if adding Warehouse to Aggr() in your actual app give more realistic numbers for you....